
|
Figure EV5
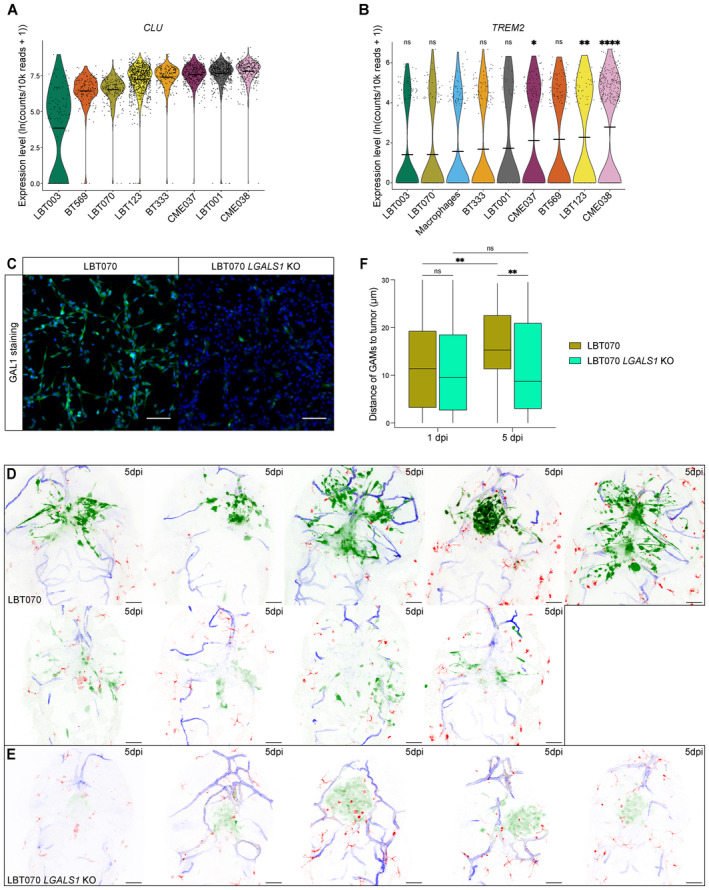
Violin plot showing Violin plot showing Representative immunofluorescence images of LBT070 Maximum intensity projections of a z stack of the head region of Boxplot of GAM distance to the tumor of all GAMs within 30 μm of the tumor, at the start of 1 and 5 dpi time‐lapse movies (
Data information: The zebrafish experiments describe biological replicates, i.e. individual zebrafish embryos. The xenograft experiment was replicated twice for LBT070