
|
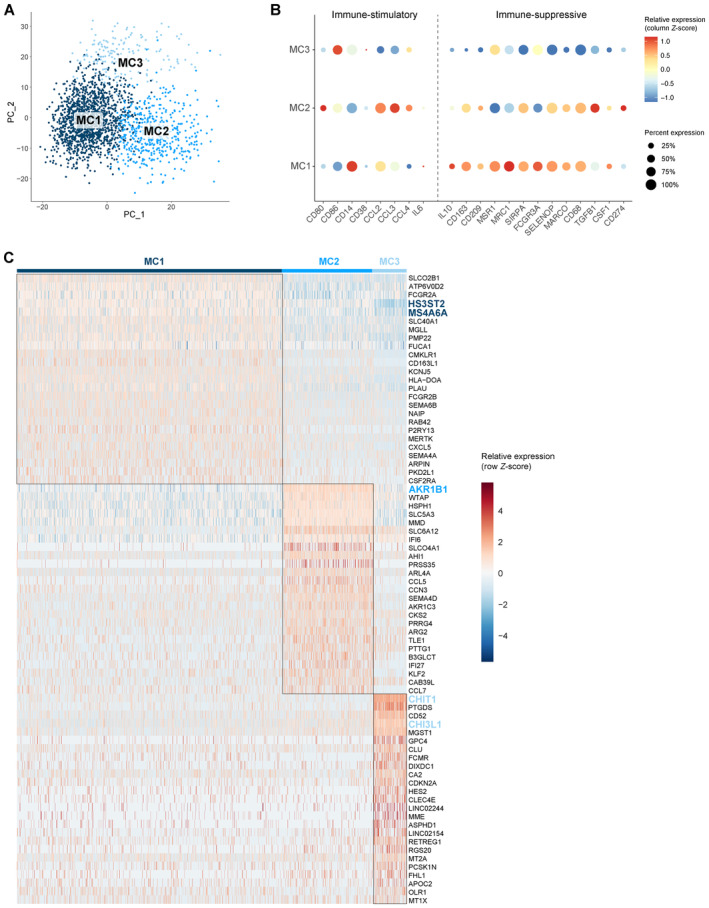
Figure 3 Molecular heterogeneity of GBM‐associated macrophages
Principal component analysis (PCA) plot of macrophage population identified three distinct macrophage subclusters (MC1‐3). PCs were calculated using the 2,000 most variable genes. Plot shows PC1 and PC2. Dot plot showing marker gene expression for immune‐stimulation and ‐suppression. Dot size indicates the percentage of cells in each macrophage subcluster expressing the gene, and dot color indicates the relative expression level. Heatmap of top 25 differentially expressed genes in the macrophage subclusters, ranked by log2(FC). Genes discussed in the text are highlighted in the subcluster colors.