
|
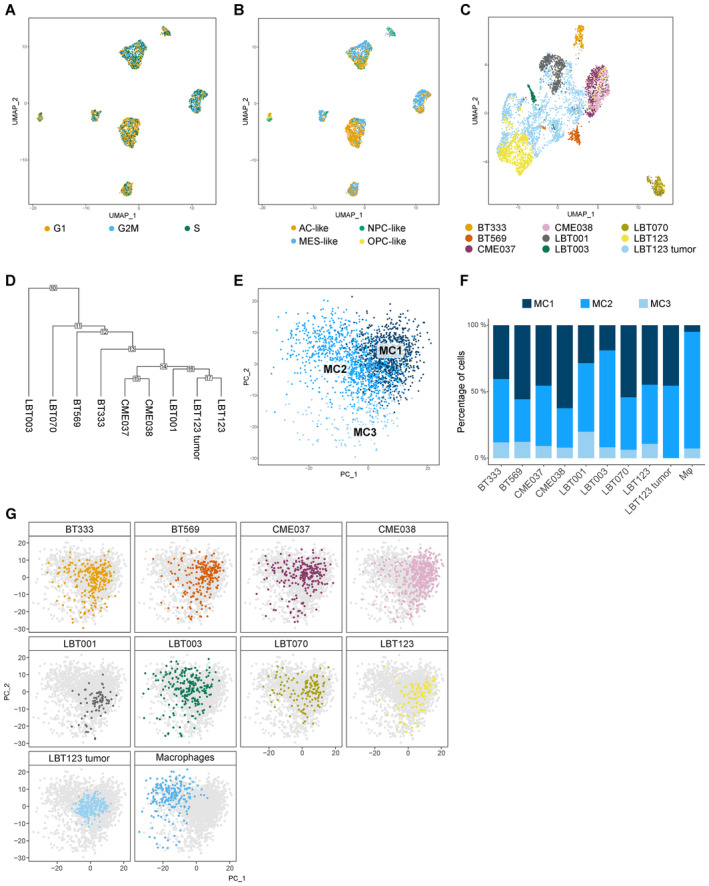
Figure EV4 Macrophage/GAM‐GSCC interactions correlate to clinical outcome in GBM patients
UMAP plot of GBM tumor cells showing cell cycle score. UMAP plot of GBM tumor cells showing Neftel subtypes. UMAP plot of GBM tumor cells, including cells from the original LBT123 tumor. Clustering tree of GBM tumor cells. The numbers in the boxes at the nodes indicate the order in which the clusters were merged during the hierarchical clustering process. The internal nodes, which start at the number of leaf nodes + 1, represent the nodes that separate groups at different levels of the hierarchical clustering. PCA plot of Macrophage/GAM subcluster distribution for the different samples, including cells from the original LBT123 tumor. m Representation of original samples on PCA plot, including the original LBT123 tumor.