
- Title
-
Cell division and cadherin-mediated adhesion regulate lens epithelial cell movement in zebrafish
- Authors
- Mochizuki, T., Luo, Y.J., Tsai, H.F., Hagiwara, A., Masai, I.
- Source
- Full text @ Development
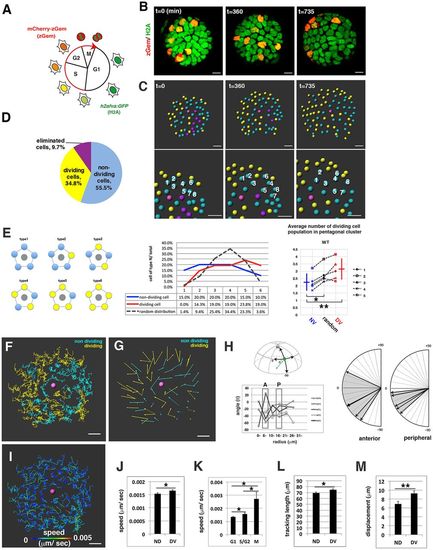
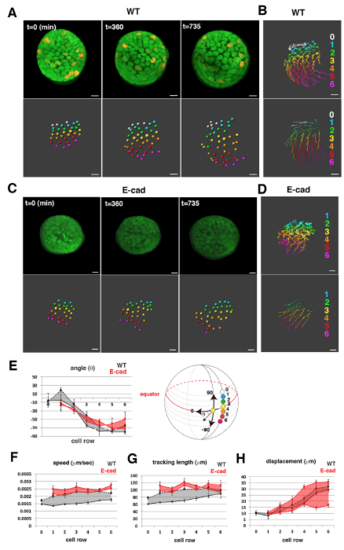
Cell movement of wild-type anterior lens epithelium. (A) Fluorescence pattern of Tg(h2afva:GFP; EF1α:mCherry-zGem). Adapted, with permission, from Mochizuki et al. (2014). (B) Anterior views of lens epithelium of Tg(h2afva:GFP; EF1α:mCherry-zGem). Time indicates the time elapsed after 33 hpf. This lens is designated as WT1. (C) (Upper) Schematics of images shown in B. Yellow, blue and purple indicate dividing, non-dividing and eliminated cell populations, respectively. (Lower) Enlarged views of upper panels. The numbers indicate individual cells in the non-dividing cell cluster. (D) Average percentages of non-dividing, dividing and eliminated cell populations in five wild-type lenses at 33 hpf. (E) (Left) Six pentagonal patterns consisting of non-dividing (blue) and dividing (yellow) cell populations. (Middle) Distribution of pentagonal patterns of WT1 at 45 hpf. The broken gray line indicates the estimated profile of pentagonal patterns when non-dividing and dividing cell populations are randomly selected. Blue and red lines indicate the profiles of pentagonal patterns, in which non-dividing and dividing cell populations are in pentagonal centers. Non-dividing and dividing cell populations tend to assemble with the same cell type. (Right) Average number of dividing cell population in non-dividing cell population-centered (blue), dividing cell population-centered (red) pentagonal clusters and random distribution model (black). Values of five wild-type lenses are plotted. Averages and s.d. are indicated by horizontal and vertical bars, respectively. (F,G) Trajectory (F) and displacement (G) in WT1. (H) Cell movement direction along the AP axis for five wild-type lenses. (Left) AP position is defined by the lens sphere radius: r=0 (anterior) to 31 µm (equator). Cell movement direction is defined by the angle (θ) between the displacement vector and the circumferential axis: θ=–90 (longitudinal) to 0 (circumferential). (Right) Cell movement direction in anterior and peripheral regions, which correspond to squares marked A and P. The range of cell movement becomes more narrow in peripheral region than in the anterior region. (I) Speed of cell movement in WT1. (J,L,M) Average speed (J), tracking length (L) and displacement (M) of non-dividing (ND) and dividing (DV) cell populations in WT1. (K) Average speed of G1, S/G2 and M phase cells in WT1. Data in J-M are mean±s.e.m. Student's t-test: *P<0.05, **P<0.01. Scale bars: 10 µm. |

ZFIN is incorporating published figure images and captions as part of an ongoing project. Figures from some publications have not yet been curated, or are not available for display because of copyright restrictions. |
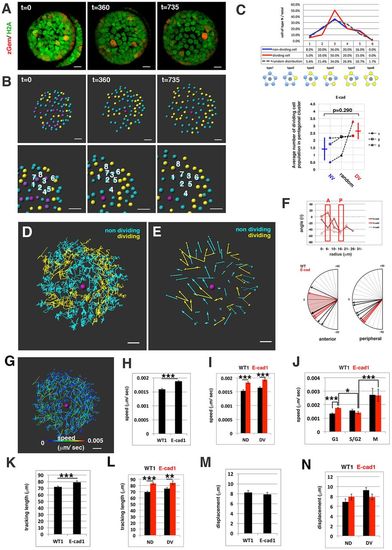
Cell movement in anterior lens epithelium of the E-cadherin mutant. (A) habrk3 mutant lens epithelium combined with Tg(h2afva:GFP; EF1α:mCherry-zGem). This lens is designated as E-cad1. (B) (Upper) Schematics of images shown in A. Yellow, blue and purple indicate dividing, non-dividing and eliminated cell populations, respectively. (Lower) Enlarged view of upper panels. Numbers indicate individual cells in the non-dividing cell cluster. (C) (Upper) Distribution of pentagonal patterns of E-cad1 at 45 hpf. Peaks of non-dividing and dividing cell populations are the same as that of the random distribution model, suggesting that dividing and non-dividing cell populations fail to segregate. (Bottom) Average number of dividing cell population in non-dividing cell population-centered (blue), dividing cell population-centered (red) pentagonal clusters and random distribution model (black). Values of three habrk3 mutant lenses are plotted. E-cad1 is indicated by the number 1. Averages and s.d. are indicated by horizontal and vertical bars, respectively. (D,E) Trajectory (D) and displacement (E) of cell movement in E-cad1. (F) (Upper) Cell movement direction in three habrk3 mutant lenses. A and P indicate anterior and peripheral regions, respectively. (Bottom) Cell movement direction in anterior and peripheral regions, which correspond to squares marked A and P, in wild-type (black arrows, shown in Fig. 1H) and habrk3 mutant lenses (red arrows). The range of cell movement direction of the habrk3 mutant is indicated in red and is less circumferential than that of the wild type in the peripheral region. (G) Speed of cell movement on trajectory of E-cad1. (H,K,M) Cell movement speed (H), tracking length (K) and displacement (M) of all lens epithelial cells in WT1 and E-cad1. (I,L,N) Cell movement speed (I), tracking length (L) and displacement (N) of non-dividing (ND) and dividing (DV) cell populations in E-cad1 (red) and WT1 (black). (J) Cell movement speed of G1, S/G2 and M phase cells in Ecad1 (red) and WT1 (black). The error bars in H-N indicate s.e.m. Student's t-test: *P<0.05, **P<0.01, ***P<0.005. Scale bars: 10 µm. |
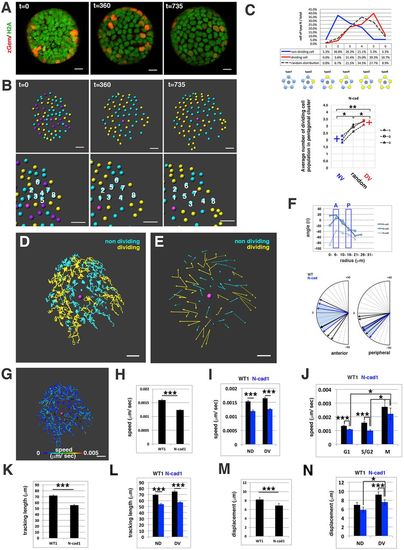
Cell movement in anterior lens epithelium of the N-cadherin morphant. (A) N-cadherin morphant lens epithelium combined with Tg(h2afva:GFP; EF1α:mCherry-zGem). This lens is designated as N-cad1. (B) (Upper) Schematics of images shown in A. Yellow, blue and purple indicate dividing, non-dividing and eliminated cell populations, respectively. (Lower) Enlarged view of upper panels. Numbers indicate individual cells in the non-dividing cell cluster. (C) (Upper) Distribution of pentagonal patterns of N-cad1 at 45 hpf. A peak shift is observed in both non-dividing and dividing cell populations. Furthermore, the segregation level is more prominent in the N-cadherin morphant. (Bottom) Average number of dividing cell population in non-dividing cell population-centered (blue), dividing cell population-centered (red) pentagonal clusters and random distribution model (black). Values of three N-cadherin morphant lenses are plotted. N-cad1 is indicated by the number 1. Averages and s.d. are indicated by horizontal and vertical bars, respectively. (D,E) Trajectory (D) and displacement (E) of cell movement in N-cad1. (F) (Upper) Cell movement direction in three N-cadherin morphant lenses. A and P indicate the anterior and peripheral regions, respectively. (Bottom) Cell movement direction in anterior and peripheral regions, corresponding to squares marked A and P, in wild-type (black arrows, shown in Fig. 1H) and N-cadherin morphant lenses (blue arrows). The range of cell movement direction of N-cadherin morphants is indicated in blue and is less circumferential than that of the wild type in the peripheral region. (G) Speed of cell movement on trajectory of N-cad1. (H,K,M) Cell movement speed (H), tracking length (K) and displacement (M) of all lens epithelial cells in WT1 and N-cad1. (I,L,N) Cell movement speed (I), tracking length (L) and displacement (N) of non-dividing (ND) and dividing (DV) cell populations in N-cad1 (blue) and WT1 (black). (J) Cell movement speed of G1, S/G2 and M phase cells in N-cad1 (blue) and WT1 (black). The error bars in H-N indicate the s.e.m. Student's t-test: *P<0.05, **P<0.01, ***P<0.005. Scale bars: 10 µm. |
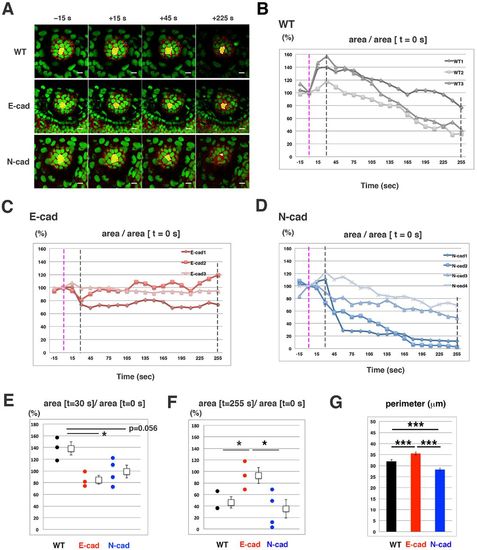
Laser ablation of lens epithelial cells. (A) Time lapse scanning of 50 hpf wild-type, E-cadherin mutant and N-cadherin morphant lenses. Time indicates the time elapsed after laser ablation. Ablated cells are indicated in green. (B-D) Temporal profile of the ablated area at 50 hpf wild-type (B), E-cadherin mutant (C) and N-cadherin morphant (D) lenses. Ablated areas are normalized by the initial area at t=0 (pink dotted line). Black dotted lines indicate the time when the ablated area reaches its peak in the wild type (t=30) as well as the time at the end of scanning (t=255). (E,F) The ablated area at t=30 (E) and t=255 (F) relative to the initial area at t=0. (G) Perimeter length of wild-type, E-cadherin mutant and N-cadherin morphant lenses at 50 hpf. The error bars indicate the s.e.m. Student's t-test: *P<0.05, ***P<0.005. Scale bars: 10 µm. |
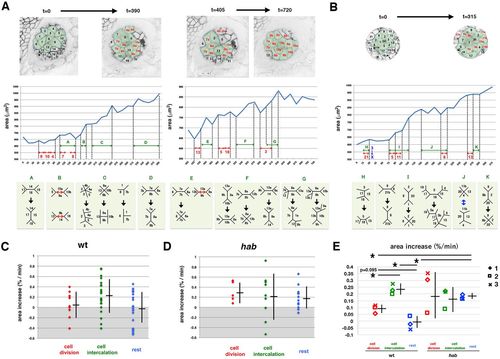
Temporal profile of lens epithelial expansion of the wild type and the E-cadherin mutant. (A) Wild-type lens epithelial area, consisting of 12 cells during the first 390 min (left panels) and 10 cells during the last 315 min (right panels). The top panels indicate the composition of individual lens epithelial cells. Divided daughter cells are in red. Middle panels display temporal profiles of the area. Red and green arrows indicate cell division events and periods when cell intercalation occurred, respectively. Bottom panels indicate cell intercalation that occurred in the corresponding period of middle panels. (B) Temporal change of habrk3 mutant lens epithelial area consisting of 14 cells during the first 315 min. (C,D) Expansion rate per time frame of lens epithelial area of wild-type (C) and habrk3 mutant (D) lens shown in A and B, respectively, during periods of cell division (red), cell intercalation (green) and the rest period (blue). Averages and s.d. are indicated by horizontal and vertical bars, respectively. The average value of the cell intercalation period is higher than others in wild type, whereas average values are similar during all three periods in habrk3 mutant. (E) The average rate of lens epithelial expansion in three wild-type and habrk3 mutant lenses. Averages and s.d. are indicated by horizontal and vertical bars, respectively. Although values of cell division period in the habrk3 mutant are variable, profiles were similar to those shown in C and D. Student's t-test: *P<0.05. PHENOTYPE:
|
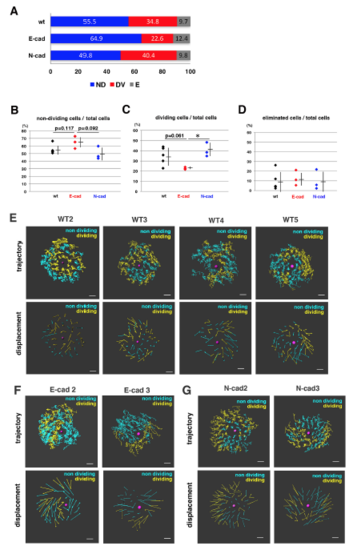
Fraction of non-dividing, dividing and eliminated cell populations in wild-type, E-cadherin mutant and N-cadherin morphant lenses (A) Histogram of mean percentages of non-dividing (ND, blue), dividing (DV, red) and eliminated (E, grey) cell populations in five wild-type, three E-cadherin mutant, and three N-cadherin morphant lenses at 33 hpf. The fraction of dividing cell population was lower in E-cadherin mutant than in wild-type and N-cadherin morphant lenses. (B–D) Fractions of non-dividing (B), dividing (C) and eliminated (D) cell populations in the anterior lens epithelium of the wild type, the E-cadherin mutant and the N-cadherin morphant at 33 hpf. Values for five wild-type, three E-cadherin mutant and three N-cadherin morphant lenses are plotted. Means and standard deviations are indicated by horizontal bars and vertical lines, respectively. Probabilities are calculated using Student’s t-test: *p<0.05. In the case that probabilities are 0.05 |
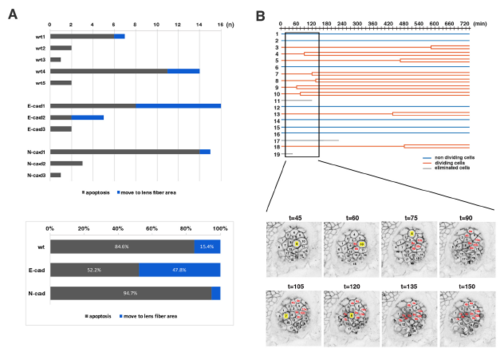
Analyses of the eliminated cell population and clustered cell divisions of wild-type lenses (A) (Upper panel) Number of two types of eliminated cell population, which underwent apoptosis (grey) and moved into the lens fiber area (blue), respectively, in individual wild-type, E-cadherin mutant, and N-cadherin morphant lenses. The number of eliminated cells were varied depending on individual lenses. Eliminated cells that moved into the lens fiber area were generally observed in lenses with a high number of eliminated cells. (Lower panel) Histogram of the percentages of two types of eliminated cell population, which underwent apoptosis (grey) and moved into the lens fiber area (blue), respectively, relative to the total number of eliminated cells observed in five wild-type, three E-cadherin mutant, and three N-cadherin morphant lenses. The fraction of eliminated cells that moved into the lens fiber area was higher in E-cadherin mutant lenses (47.8%) than in wild-type lenses (15.4%), suggesting that E-cadherin suppresses cell movement from lens epithelium into the lens fiber area. In N-cadherin morphant lenses, this fraction was only 5.3%, much less than in wild-type lenses (15.4%). (B) (Upper panel) Lineages of lens epithelial cells from zebrafish transgenic line, Tg(h2afva:GFP; EF1α:mCherry-CAAX) from 33 to 45 hpf, also shown in Movie2. Red, blue, and grey lines indicate dividing, non-dividing, and eliminated cell populations, respectively. (Lower panel) Confocal images for 135 min shown as squares in the upper panel. Only mCherry-CAAX fluorescence is shown. Numbers on individual cells correspond to cell numbers in the upper panel. Yellow squares and red numbers indicate mitotic cells and their daughter cells, respectively. |
Cell movement in the equatorial region of the wild-type and the E-cadherin mutant (A, C) Confocal images (upper) and nuclear positions (lower) in the equatorial region of wild-type (A) and habrk3 mutant (C) lenses combined with Tg(h2afva:GFP; EF1α:mCherry-zGem). Times elapsed after 33 hpf are indicated. (B, D) Trajectory (upper) and displacement (lower) of cell movement in the equatorial region of wild-type (B) and habrk3 mutant (D) lenses. (E) Cell movement direction in the equatorial region of two wild-type (black) and habrk3 mutant (red) lenses. Solid lines indicate the lens shown in (A–D). The zone between two lenses is indicated in color. The right panel indicates the definition of cell movement direction (θ). (F–H) Speed (F), tracking length (G) and displacement (H) of cell movement in the equatorial region of two wild-type (black) and habrk3 mutant (red) lenses. Solid lines indicate the lens shown in (A–D). The zone between two lenses is indicated in color. Error bars indicate the standard error of the mean. Scale: 10 μm (A-D). |
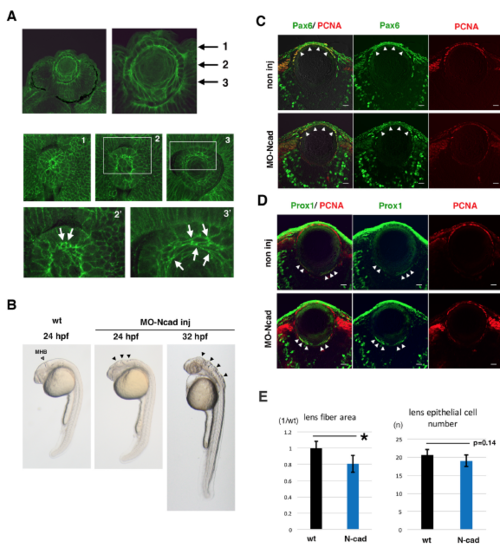
Lens fiber growth defects in an N-cadherin morphant (A) Immuno-labeling of zebrafish lens with anti-N-cadherin antibody. The top two panels show sections of the retina and lens at 33 hpf. The middle three and bottom two panels show confocal scanning of horizontal planes in whole mount lens at 27 hpf. Three planes perpendicular to the AP axis, which contain the apical lens fiber suture (plane 1), the equatorial area (plane 2), and elongating lens fiber cells (plane 3), are shown in panels 1, 2, and 3, respectively. The bottom two panels indicate higher magnification images of white squares shown in panels 2 and 3. N-cadherin protein is markedly accumulated in plasma membrane of apical tips (arrows in panel 2’) and the intermediate flattened region (arrows in panel 3’) of lens fiber cells. These data suggest that N-cadherin is strongly expressed in elongating lens fiber cells. (B) Morphology of N-cadherin morphant embryos at 24 and 32 hpf. The open arrowhead indicates the position of the midbrain-hindbrain boundary (MHB) in wild-type 24 hpf embryos. Black arrowheads indicate the failure of neural tube closure around the MHB in N-cadherin morphant embryos at 24 and 32 hpf. (C–D) Labeling of wild-type and N-cadherin morphant lenses with antibodies against PCNA (red, C and D), Pax6 (green, C) and Prox1 (green, D). In the N-cadherin morphant, lens epithelial cells and differentiating lens fiber cells normally express Pax6 (arrowheads, C) and Prox1 (arrowheads, D), respectively. (E) Histogram of lens fiber area size (left) and the number of lens epithelial cells (right) in wild-type (black) and N-cadherin morphants (blue). Six independent lenses for 72 hpf wild-type and N-cadherin morphant embryos were used to measure lens fiber area size with Image-J and to count lens epithelial cells on plastic sections that cover the central region of the lens sphere. The standard deviation is indicated. Student’s t-test; * p<0.05. Scale: 10 μm (C, D). |
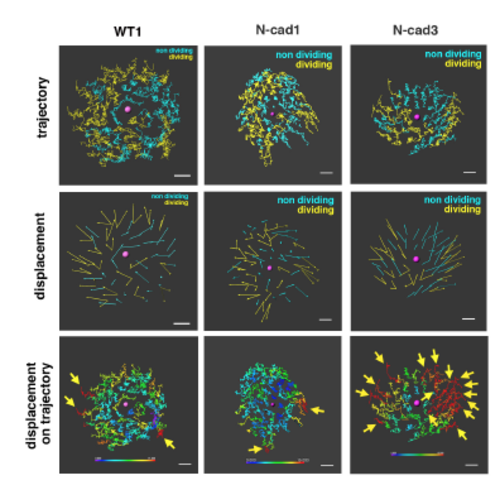
Analyses of cell movement in the anterior lens epithelium of an N-cadherin morphant Trajectory (upper panels) and displacement (middle panels) of lens epithelial cells in wild-type, namely WT1, and N-cadherin morphant lenses, namely N-cad1 and N-cad3. The N-cad1 lens above is also shown in Figure 3. Blue and yellow colors indicate non-dividing and dividing cell populations, respectively. In the N-cad3 lens, the dividing cell population was unevenly located in the anterior epithelium. (Bottom panels) Displacement length shown in the trajectory of lens epithelial cells. The color range from blue to red corresponds to displacement length from low (0 μm) to high (15 μm), respectively. WT1, N-cad1, and N-cad3 lenses are shown. Yellow arrows indicate cells with longer displacements (>15 μm, red). The WT1 and N-cad1 lenses have a few long-displacement cells only in the peripheral region, whereas the N-cad3 lens has 15 long-displacement cells. Scale: 10 μm. |
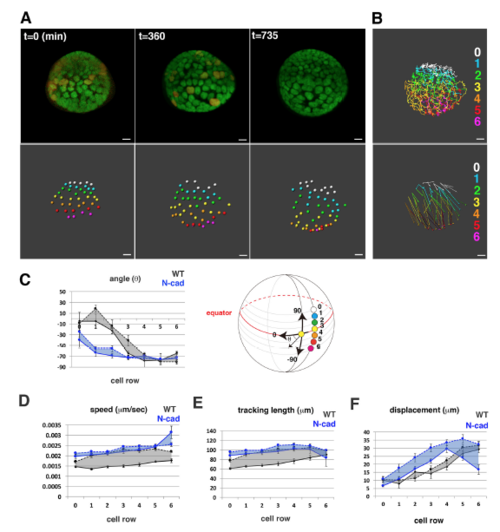
Cell movement in the equatorial region of an N-cadherin morphant (A) Confocal images (upper) and nuclear positions (lower) of the equatorial region of an N-cadherin morphant lens combined with Tg(h2afva:GFP; EF1α:mCherry-zGem). Time elapsed after 33 hpf is indicated. (B) Trajectory of cell movement (upper) and cell displacement (lower) in the equatorial region of an N-cadherin morphant. (C) Cell movement direction in the equatorial region of two wild-type (black) and N-cadherin morphant (blue) lenses. Solid lines indicate the lens shown in (A–B). The zone between two lenses is colored. (D–F) Speed (D), tracking length (E) and displacement (F) in the equatorial region of two wild type (black) and N-cadherin morphant (blue) lenses. Solid lines indicate the lens shown in (A–B). The zone between two lenses is indicated in color. Error bars indicate the standard error of the mean. Scale: 10 μm (A–B). |
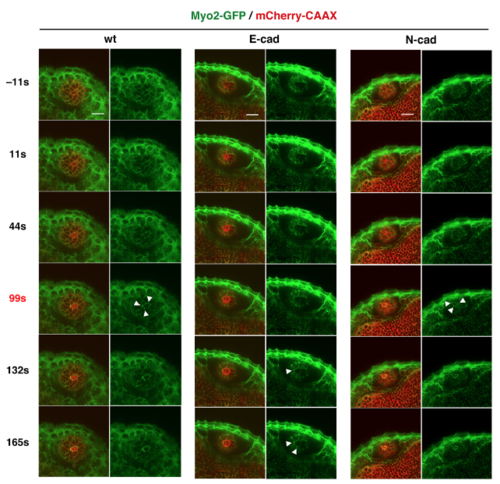
Analyses of Myosin2 accumulation in response to laser ablation Time-lapse scanning of 50 hpf wild-type, E-cadherin, and N-cadherin morphant lens epithelia expressing Tg(actb1:myl12.1-eGFP; EF1α: mCherry-CAAX) after laser ablation. The right columns indicate only the green channel (Myosin 2). White arrowheads indicate accumulation of Myosin2 in cell membranes surrounding the ablated area. Myosin2 accumulated in all cases: wild-type, E-cadherin and N-cadherin morphant lenses, although accumulation was delayed in E-cadherin morphant lenses and occurred irregularly in patches in both E- and N-cadherin morphant lenses. Scale: 20 μm. |
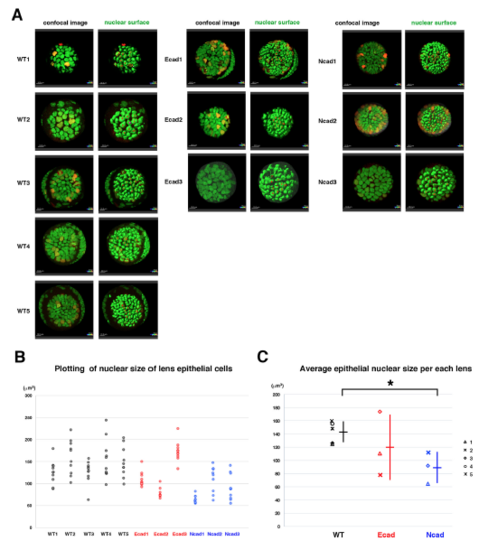
Analyses of nuclear size of lens epithelial cells (A) Confocal images (left) and surface objects demarcating lens epithelial nucleus (right) in wild-type, E-cadherin mutant, and N-cadherin morphant anterior lens epithelia at an early stage of the scanned period: 33–36 hpf. Ten lens epithelial cell nuclei randomly selected for measurement of nuclear volume are indicated in red in the right panels. (B) Plotting of nuclear volumes of individual lens epithelial cells per each of wild-type, E-cadherin mutant, and N-cadherin morphant lenses. Distribution range was variable depending on individual lenses, but the range was reduced in E-cad1, E-cad2 and three N-cad lenses and elevated in E-cad3 lenses, compared with wild-type lenses. (C) Plotting of average nuclear volumes of lens epithelial cells in each lens. Horizontal bars and vertical lines indicate mean and standard deviation of lens epithelial nuclear volume, respectively. Nuclear size of lens epithelial cells was significantly smaller in the N-cadherin morphant than in wild type, whereas the range was broader in the E-cadherin mutant than in wild type. In the N-cadherin morphant, a reduced tensile force and prominent E-cadherin-dependent cell adhesion may reduce nuclear size. In E-cadherin mutant, the absence of adherens junction may weaken the tensile force transmission from plasma membranes to nuclear membranes, resulting in variable nuclear size. Probability is calculated using Student’s t-text: *p<0.05. |
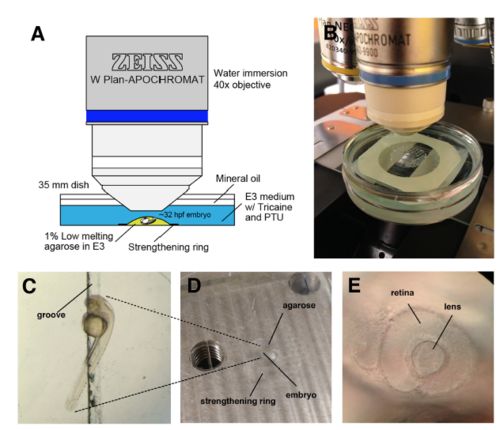
Set-up for time-lapse imaging of zebrafish lens epithelium (A) Schematic illustration of the imaging setup. (B) Real set-up picture. (C) The embryo was mounted in 1% low-melting agarose, and the yolk was put into the groove in order to orient the embryo laterally. (D) The agarose was restricted within the inner circle of a strengthening ring on the groove stretched into the acrylic plate. (E) The lateral side of the embryonic eye was used for confocal z-stack scanning. |
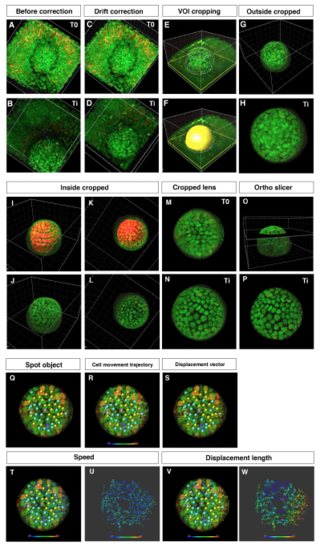
Procedure for obtaining 3D time-lapse images of anterior lens epithelium (A–D) Two time points from T0 to Ti of embryonic eyes without (A, B) and with drift correction (C, D). (E, F) VOI cropping by drawing outside contour circles and creation of a surface masking the lens. (G, H) Outside cropped lens. (I–L) Cropping of the lens fiber area by drawing inside contour circles and by creating a surface masking the lens fiber area. (M, N) Cropped lens at T0 and Ti. (O, P) Extract of anterior lens epithelium using the “Ortho Slicer” tool. (Q–W) Analysis of cell movement of lens epithelial cells. (Q) Assignment of spot objects to trace cell lineages, which classify epithelial cells into dividing (yellow), non-dividing (blue), and eliminated cell populations (purple). (R) Cell movement trajectory, (S) displacement vector, (T–U) cell movement speed, and (V–W) displacement length. |
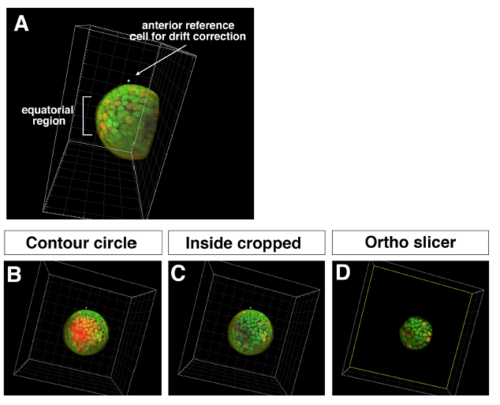
Procedure for obtaining 3D time-lapse images of equatorial lens epithelium (A) Side view of the lens scanned from the ventral view. Tissues outside the lens sphere, such as the retina and the cornea, were removed by cropping. Anterior reference position used for drift correction and the equatorial region are indicated. (B) Equatorial view of the lens before cropping the lens fiber core. Contour of the surface masking the lens fiber core is indicated (red). (C) Equatorial view of the lens after cropping the lens fiber core. (D) Only the equatorial lens epithelium was extracted using the “Ortho slicer” tool. |
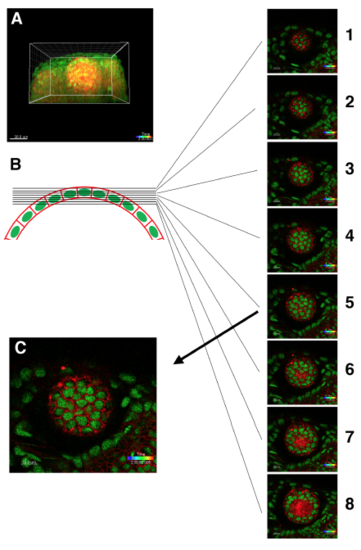
Procedure for selecting a confocal slice of the most apical lens epithelium (A) 3D confocal image of Tg(h2afva:GFP; EF1α:mCherry-CAAX) transgenic fish lens. (B) Schematic picture of zebrafish lens epithelium and z-axis slice level. Eight slices containing the anterior lens epithelium from the anterior to posterior direction are shown. The interval between neighboring slices is 1 μm. Three posterior slices, #6–8, contains the lens fiber region. Thus, the #5 slice is the most suitable for analysis of cell intercalation and epithelial rearrangement, because CAAX-labeled plasma-membranes correspond to the adherens junction complex-containing domain. (C) The confocal slice containing the most apical lens epithelium just adjacent to the lens fiber core (indicated as the #5 slice in B), which was used to make a movie and to analyze cell division, cell intercalation, and area expansion. |