
|
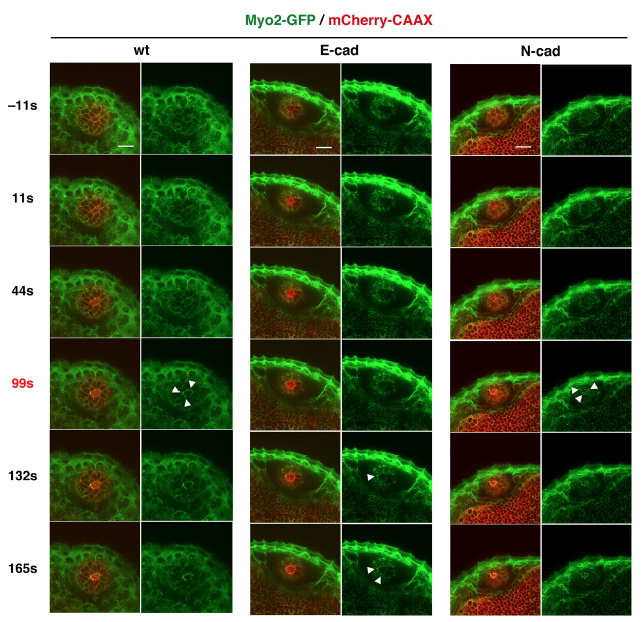
Fig. S8
Analyses of Myosin2 accumulation in response to laser ablation
Time-lapse scanning of 50 hpf wild-type, E-cadherin, and N-cadherin morphant lens epithelia expressing Tg(actb1:myl12.1-eGFP; EF1α: mCherry-CAAX) after laser ablation. The right columns indicate only the green channel (Myosin 2). White arrowheads indicate accumulation of Myosin2 in cell membranes surrounding the ablated area. Myosin2 accumulated in all cases: wild-type, E-cadherin and N-cadherin morphant lenses, although accumulation was delayed in E-cadherin morphant lenses and occurred irregularly in patches in both E- and N-cadherin morphant lenses. Scale: 20 μm.