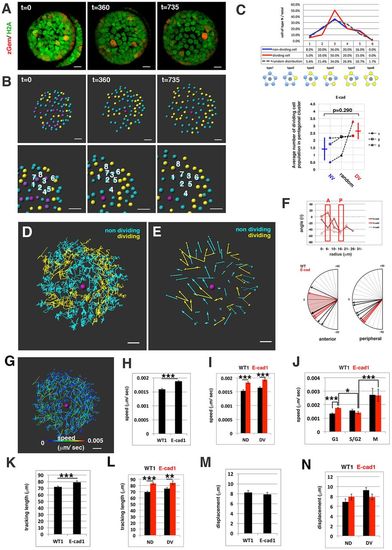
Cell movement in anterior lens epithelium of the E-cadherin mutant. (A) habrk3 mutant lens epithelium combined with Tg(h2afva:GFP; EF1α:mCherry-zGem). This lens is designated as E-cad1. (B) (Upper) Schematics of images shown in A. Yellow, blue and purple indicate dividing, non-dividing and eliminated cell populations, respectively. (Lower) Enlarged view of upper panels. Numbers indicate individual cells in the non-dividing cell cluster. (C) (Upper) Distribution of pentagonal patterns of E-cad1 at 45 hpf. Peaks of non-dividing and dividing cell populations are the same as that of the random distribution model, suggesting that dividing and non-dividing cell populations fail to segregate. (Bottom) Average number of dividing cell population in non-dividing cell population-centered (blue), dividing cell population-centered (red) pentagonal clusters and random distribution model (black). Values of three habrk3 mutant lenses are plotted. E-cad1 is indicated by the number 1. Averages and s.d. are indicated by horizontal and vertical bars, respectively. (D,E) Trajectory (D) and displacement (E) of cell movement in E-cad1. (F) (Upper) Cell movement direction in three habrk3 mutant lenses. A and P indicate anterior and peripheral regions, respectively. (Bottom) Cell movement direction in anterior and peripheral regions, which correspond to squares marked A and P, in wild-type (black arrows, shown in Fig. 1H) and habrk3 mutant lenses (red arrows). The range of cell movement direction of the habrk3 mutant is indicated in red and is less circumferential than that of the wild type in the peripheral region. (G) Speed of cell movement on trajectory of E-cad1. (H,K,M) Cell movement speed (H), tracking length (K) and displacement (M) of all lens epithelial cells in WT1 and E-cad1. (I,L,N) Cell movement speed (I), tracking length (L) and displacement (N) of non-dividing (ND) and dividing (DV) cell populations in E-cad1 (red) and WT1 (black). (J) Cell movement speed of G1, S/G2 and M phase cells in Ecad1 (red) and WT1 (black). The error bars in H-N indicate s.e.m. Student's t-test: *P<0.05, **P<0.01, ***P<0.005. Scale bars: 10 µm.
|
