
Fig. S5
- ID
- ZDB-FIG-180906-20
- Publication
- Mochizuki et al., 2017 - Cell division and cadherin-mediated adhesion regulate lens epithelial cell movement in zebrafish
- Other Figures
- All Figure Page
- Back to All Figure Page
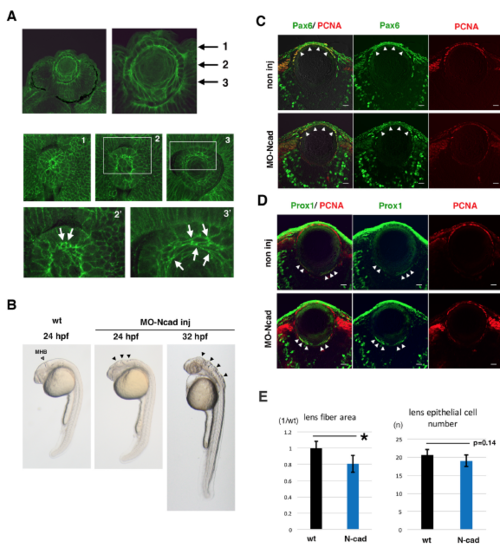
Lens fiber growth defects in an N-cadherin morphant (A) Immuno-labeling of zebrafish lens with anti-N-cadherin antibody. The top two panels show sections of the retina and lens at 33 hpf. The middle three and bottom two panels show confocal scanning of horizontal planes in whole mount lens at 27 hpf. Three planes perpendicular to the AP axis, which contain the apical lens fiber suture (plane 1), the equatorial area (plane 2), and elongating lens fiber cells (plane 3), are shown in panels 1, 2, and 3, respectively. The bottom two panels indicate higher magnification images of white squares shown in panels 2 and 3. N-cadherin protein is markedly accumulated in plasma membrane of apical tips (arrows in panel 2’) and the intermediate flattened region (arrows in panel 3’) of lens fiber cells. These data suggest that N-cadherin is strongly expressed in elongating lens fiber cells. (B) Morphology of N-cadherin morphant embryos at 24 and 32 hpf. The open arrowhead indicates the position of the midbrain-hindbrain boundary (MHB) in wild-type 24 hpf embryos. Black arrowheads indicate the failure of neural tube closure around the MHB in N-cadherin morphant embryos at 24 and 32 hpf. (C–D) Labeling of wild-type and N-cadherin morphant lenses with antibodies against PCNA (red, C and D), Pax6 (green, C) and Prox1 (green, D). In the N-cadherin morphant, lens epithelial cells and differentiating lens fiber cells normally express Pax6 (arrowheads, C) and Prox1 (arrowheads, D), respectively. (E) Histogram of lens fiber area size (left) and the number of lens epithelial cells (right) in wild-type (black) and N-cadherin morphants (blue). Six independent lenses for 72 hpf wild-type and N-cadherin morphant embryos were used to measure lens fiber area size with Image-J and to count lens epithelial cells on plastic sections that cover the central region of the lens sphere. The standard deviation is indicated. Student’s t-test; * p<0.05. Scale: 10 μm (C, D). |