
Fig. 1
- ID
- ZDB-FIG-180906-12
- Publication
- Mochizuki et al., 2017 - Cell division and cadherin-mediated adhesion regulate lens epithelial cell movement in zebrafish
- Other Figures
- All Figure Page
- Back to All Figure Page
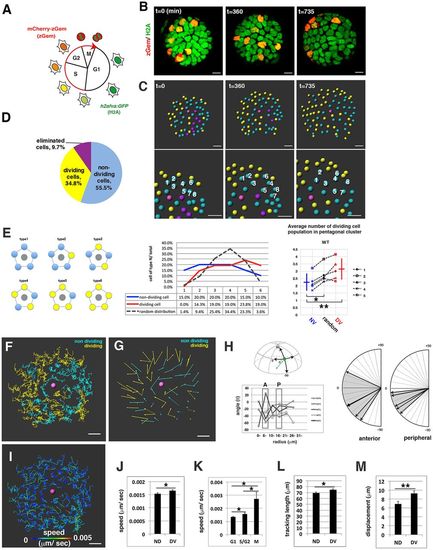
Cell movement of wild-type anterior lens epithelium. (A) Fluorescence pattern of Tg(h2afva:GFP; EF1α:mCherry-zGem). Adapted, with permission, from Mochizuki et al. (2014). (B) Anterior views of lens epithelium of Tg(h2afva:GFP; EF1α:mCherry-zGem). Time indicates the time elapsed after 33 hpf. This lens is designated as WT1. (C) (Upper) Schematics of images shown in B. Yellow, blue and purple indicate dividing, non-dividing and eliminated cell populations, respectively. (Lower) Enlarged views of upper panels. The numbers indicate individual cells in the non-dividing cell cluster. (D) Average percentages of non-dividing, dividing and eliminated cell populations in five wild-type lenses at 33 hpf. (E) (Left) Six pentagonal patterns consisting of non-dividing (blue) and dividing (yellow) cell populations. (Middle) Distribution of pentagonal patterns of WT1 at 45 hpf. The broken gray line indicates the estimated profile of pentagonal patterns when non-dividing and dividing cell populations are randomly selected. Blue and red lines indicate the profiles of pentagonal patterns, in which non-dividing and dividing cell populations are in pentagonal centers. Non-dividing and dividing cell populations tend to assemble with the same cell type. (Right) Average number of dividing cell population in non-dividing cell population-centered (blue), dividing cell population-centered (red) pentagonal clusters and random distribution model (black). Values of five wild-type lenses are plotted. Averages and s.d. are indicated by horizontal and vertical bars, respectively. (F,G) Trajectory (F) and displacement (G) in WT1. (H) Cell movement direction along the AP axis for five wild-type lenses. (Left) AP position is defined by the lens sphere radius: r=0 (anterior) to 31 µm (equator). Cell movement direction is defined by the angle (θ) between the displacement vector and the circumferential axis: θ=–90 (longitudinal) to 0 (circumferential). (Right) Cell movement direction in anterior and peripheral regions, which correspond to squares marked A and P. The range of cell movement becomes more narrow in peripheral region than in the anterior region. (I) Speed of cell movement in WT1. (J,L,M) Average speed (J), tracking length (L) and displacement (M) of non-dividing (ND) and dividing (DV) cell populations in WT1. (K) Average speed of G1, S/G2 and M phase cells in WT1. Data in J-M are mean±s.e.m. Student's t-test: *P<0.05, **P<0.01. Scale bars: 10 µm. |
| Genes: | |
|---|---|
| Fish: | |
| Anatomical Term: | |
| Stage Range: | Prim-15 to High-pec |