
|
Fig. S7
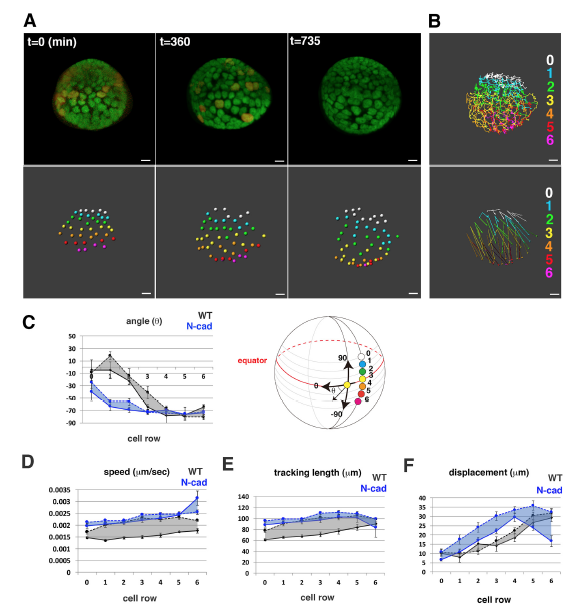
Cell movement in the equatorial region of an N-cadherin morphant
(A) Confocal images (upper) and nuclear positions (lower) of the equatorial region of an N-cadherin morphant lens combined with Tg(h2afva:GFP; EF1α:mCherry-zGem). Time elapsed after 33 hpf is indicated.
(B) Trajectory of cell movement (upper) and cell displacement (lower) in the equatorial region of an N-cadherin morphant.
(C) Cell movement direction in the equatorial region of two wild-type (black) and N-cadherin morphant (blue) lenses. Solid lines indicate the lens shown in (A–B). The zone between two lenses is colored.
(D–F) Speed (D), tracking length (E) and displacement (F) in the equatorial region of two wild type (black) and N-cadherin morphant (blue) lenses. Solid lines indicate the lens shown in (A–B). The zone between two lenses is indicated in color. Error bars indicate the standard error of the mean. Scale: 10 μm (A–B).