
|
Fig. S4
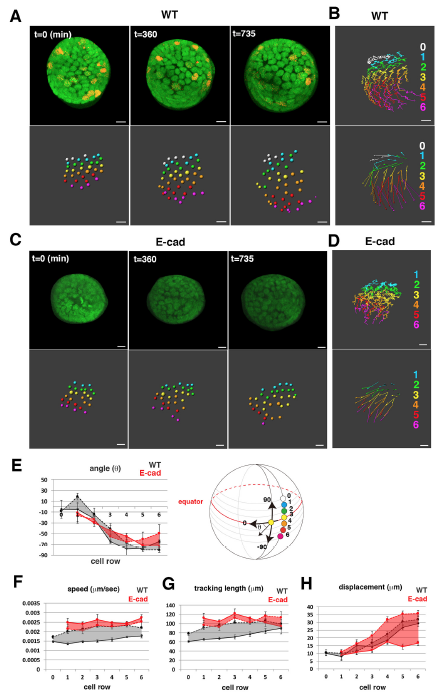
Cell movement in the equatorial region of the wild-type and the E-cadherin mutant
(A, C) Confocal images (upper) and nuclear positions (lower) in the equatorial region of wild-type (A) and habrk3 mutant (C) lenses combined with Tg(h2afva:GFP; EF1α:mCherry-zGem). Times elapsed after 33 hpf are indicated.
(B, D) Trajectory (upper) and displacement (lower) of cell movement in the equatorial region of wild-type (B) and habrk3 mutant (D) lenses.
(E) Cell movement direction in the equatorial region of two wild-type (black) and habrk3 mutant (red) lenses. Solid lines indicate the lens shown in (A–D). The zone between two lenses is indicated in color. The right panel indicates the definition of cell movement direction (θ).
(F–H) Speed (F), tracking length (G) and displacement (H) of cell movement in the equatorial region of two wild-type (black) and habrk3 mutant (red) lenses. Solid lines indicate the lens shown in (A–D). The zone between two lenses is indicated in color. Error bars indicate the standard error of the mean. Scale: 10 μm (A-D).