
- Title
-
Type IV Collagen Controls the Axogenesis of Cerebellar Granule Cells by Regulating Basement Membrane Integrity in Zebrafish
- Authors
- Takeuchi, M., Yamaguchi, S., Yonemura, S., Kakiguchi, K., Sato, Y., Higashiyama, T., Shimizu, T., Hibi, M.
- Source
- Full text @ PLoS Genet.

There are three types of GCs in zebrafish cerebellum. (A-D) Single-cell labeling was performed by crossing the GC-specific Gal4 line gSA2AzGFF152B and partially silenced UAS:Kaede reporter line (A, B, C), or by injecting UAS:Kaede reporter DNA in a Tol1 vector and Tol1 transposase RNA into the GC (in the LCa)-specific Gal4 line gSAIGFF23C (Fig 1D). Larvae at 5 dpf that expressed Kaede in one or a few GCs were selected, and Kaede was visualized by immunostaining with an anti-Kaede antibody. Dorsal projection views in the cerebellum. Co-staining with an antibody against Neurod, a GC marker, indicated that the Kaede+ cells in the cerebellum were GCs (A). (E) Schematic representation of the GC types. The GCs in the Va and CCe (rostromedial lobes) had a T-shaped axon, which formed parallel fibers with other GC axons, and targeted the dendrites of PCs (Ea). The GCs in the EG also had a T-shaped axon, which extended bilaterally and turned caudally to the dorsal hindbrain (Eb). The GCs in the LCa extended their axon only ipsilaterally, and it turned caudally. The GCs in the EG and LCa (caudolateral lobes) made synapses on the dendrites of PCs in the cerebellum and on those of crest cells (Cr) in the dorsal hindbrain (crista cerebellaris). Scale bars: 40 μm in A-D. EXPRESSION / LABELING:
|

Type IV collagen gene col4a6 is required for axogenesis of the GCs in caudolateral lobes. (A-D) Staining with an anti-Vglut1 antibody, which marks the presynaptic termini of GC axons, revealed that the GCs in the caudolateral lobes of 5-dpf homozygous shiomaneki (siork18/rk18) mutants had abnormal axons, which formed abnormally branched bundles (C, D). Dorsal projection views of wild-type control (A, B) and sio mutant (C, D) cerebella. (E, F) Labeling of the caudolateral GCs in the GC-specific Gal4 line hspGFFDMC90A also showed aberrant axogenesis (marked by arrowheads in F). Dorsal views of the control (E) and sio mutant (F) cerebella. (G) Schematic representation of sio phenotypes. Dorsal views. (H) The sio locus was mapped to chromosome 7, between 41.69 and 43.12 Mb from the telomere. The type IV collagen genes col4a6 and col4a5 are located in this region. The numbers of recombinations in the mutant genomes are indicated. (I) The mutant contained a T-to-C point mutation in a splicing donor site of the col4a6 gene. (J) Detection of mutant transcripts by RT-PCR with primers (P1, P2) shown in K. (K) Structures of the wild-type and mutant transcripts. (L) Structures of the wild-type and mutant proteins. ‘Collagenous’ and ‘NC1’ represent the collagenous domain and non-collagenous domain 1, respectively. The mutant transcripts and proteins in K and L correspond to the PCR bands indicated by the same number in J. (Ma-Pb) Expression of col4a6 (Ma, Na) and col4a5 (Oa, Pa) in wild-type (Ma, Mb, Oa, Ob) and sio (Na, Nb, Pa, Pb) larvae at 3 dpf. Lateral views (Ma-Pa) and cross sections of the dorsal hindbrain region (Mb-Pb). (Q-W) The abnormal axogenesis of the caudolateral GCs in the sio mutants was suppressed by expressing wild-type col4a6. col4a6 RNA (50 pg) was injected into one-cell-stage embryos from a cross between sio heterozygotes (T-W). The resultant 5-dpf larvae were stained with an anti-Vglut1 antibody. Uninjected controls for wild-type (Q) and siork18/rk18 (R, S) larvae are also shown. Some of the injected sio larvae showed normal GC axons (U), and others showed a relatively weak abnormality in the GC axons (V). The number of abnormal GC axon branches in a larva is indicated (W). The abnormal branch points were counted in the uninjected wild-type (4 larvae) and sio mutants (3 larvae) and in the col4a6 RNA-injected wild-type (3 larvae) and sio mutants (6 larvae), and the means were calculated. The injection of col4a6 RNA significantly reduced the number of abnormal branch points (*, P<0.05). Scale bars: 50 μm in A, C; 20 μm in B, D; 500 μm in Pa (applied to Ma, Na, Oa); 25 μm in Pb (applied to Mb, Nb, Ob); 50 μm in V (applied to Q, R, S, T, U). EXPRESSION / LABELING:
PHENOTYPE:
|

The Col4a5 and Col4a6 complex plays a role in the axogenesis of GCs and RGCs. Wild-type (A-E), col4a6rk18/rk18 (F-J), and col4a5s510/s510 (K-O) mutant 5-dpf larvae harboring the pou4f3:Gal4, UAS:GAP-GFP transgene, which labels the axons of retinal ganglion cells (RGCs) in a mosaic manner, were stained with anti-Vglut1 (magenta) and anti-GFP (green) antibodies. Dorsal projection views (A-C, F-H, K-M) of the midbrain/hindbrain (A, F, K), left half of the rostral hindbrain (B, G, L), and half of the tectum (C, H, M). Lateral view of the tectum (D, I, N). Both col4a6 and col4a5 mutant larvae showed abnormal branching of the GC bundles (indicated by arrows, G, L). In wild type animals, each RGC projected to a single layer in the tectum (D), whereas in the col4a6 and col4a5 mutants some RGC axons trespassed between tectal layers (marked by arrows in I and N). (E, J, O) Schematic drawing of the RGC axons (lateral view). SO, stratum opticus; SFGS, stratum fibrosum et griseum superficiale. The statistic analysis is shown in S2 Table. Scale bars: 100 μm in K (applied to A, F); 20 μm in L (applied to B, G); 20 μm in M (applied to C, H); 20 μm in N (applied to D, I). |
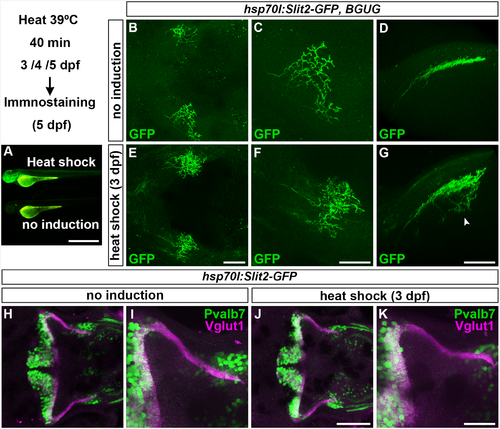
Slit may not be involved in the axogenesis of GCs. Slit2 was overexpressed using the hsp70l:Slit2-GFP; pou4f3:Gal4 UAS:GAP43-GFP (B-G), or hsp70l:Slit2-GFP (H-K) lines during development of the RGC and GC axons (3/4/5 dpf). The structure of the RGC and GC axons was examined at 5 dpf. Slit2-GFP was detected after 40 min of heat shock (A, lower panel). (B-G) Heat shock-induced overexpression of Slit2-GFP at 3 dpf induced abnormal axonal projections (trespass) of the RGCs (n = 2/2, indicated by an arrowhead in G). The RGC axons were visualized by immunohistochemistry with an anti-GFP antibody. Control non-induced (B, C, D) and heat-shocked larvae (E, F, G). Low- (B, E) and high-magnification dorsal views (C, F), and lateral views (D, G) of the tectum. (H-K) Heat shock-mediated overexpression of Slit2-GFP at 3 dpf did not affect the formation of GC axons (n = 10/10, J, K). The larvae were stained with anti-Vglut1 (GC axons, magenta) and parvalbumin7 (Pvalb7, PCs, green) antibodies. Overexpression at 4 or 5 dpf also did not affect the GC axons (S4 Fig). Statistic analysis is shown in S3 Table. Scale bars: 1 mm in A; 50 μm in E (applied to B), 40 μm in F (applied to C); 40 μm in G (applied to D); 100 μm in J (applied to H); 40 μm in K (applied to I). |

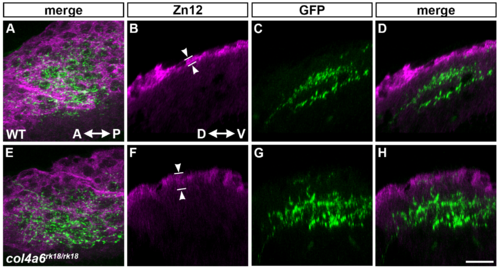
Col4a6 and Col4a5 are required for BM integrity. Wild-type (A, D, E, J, L) and col4a5 (B, F, G) and col4a6 (C, H, I, K, M) mutant larvae at 5 dpf were stained with anti-laminin–1 (A-I), anti-HNK–1 (zn12, J-K), or anti-HSPGs (10E4, L, M) antibodies. (A-C, J-M) BM in the dorsal hindbrain. Dorsal views of the rostral hindbrain, optical sections. (D-I) BM in the tectal region. RGC axons marked by pou4f3:Gal4; UAS:GAP-GFP (green) were co-stained with an anti-GFP antibody in the tectum; dorsal projection views (D, F, H) and lateral views (E, G, I). The laminin–1+ BM structure was split in the dorsal hindbrain region of the col4a5 and col4a6 mutants (indicated by arrowheads, B, C). In the tectal region of these mutants, the laminin–1+ BM was split into two layers: one attached to the skin and the other located more internally with intermittent disruption (arrowheads, G, I). Some RGC axons were located in the interspace between the two BMs in the mutant tectum (indicated by arrows, G, I). Signals for HNK–1 and HSPGs (marked by arrowheads) in the dorsal hindbrain BM of the col4a6 mutants (K, M) were weaker than in wild type (J, L). (N, O) Schematic drawing of head (N) and hindbrain (O) regions. The laminin–1+ structures are marked by brown lines and the BM surrounding the hindbrain is marked by arrowheads (O). The statistic analysis is shown in S4 Table. Scale bars: 20 μm in C (applied to A, B); 20 μm in H (applied to D, F); 30 μm in I (applied to E, G); 20 μm in M (applied to J, K, L, M). |

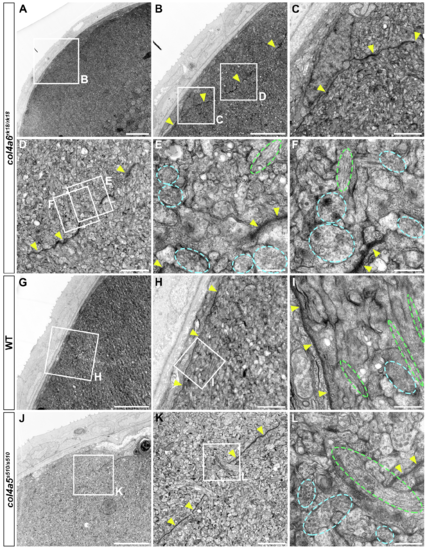
BM structure is disrupted in the col4a6 mutant hindbrain. Dorsal hindbrain of 5 dpf wild-type (A, B) and col4a6 mutant (C-F) larvae was analyzed by electron microscopy. Cross sections (A, C). (B, D) Higher-magnification views of box B in A and box D in C. (E, F) Higher-magnification images of boxes E and F in D. The BM is indicated by yellow arrowheads. Axons containing synaptic vesicles are marked by blue dashed circles. The BM was branched (E) or truncated (F) in the col4a6 mutant hindbrain. N, nucleus. Scale bars: 10 μm in A; 2 μm in B; 10 μm in C; 2 μm in D; 0.5 μm in E; 0.5 μm in F. PHENOTYPE:
|

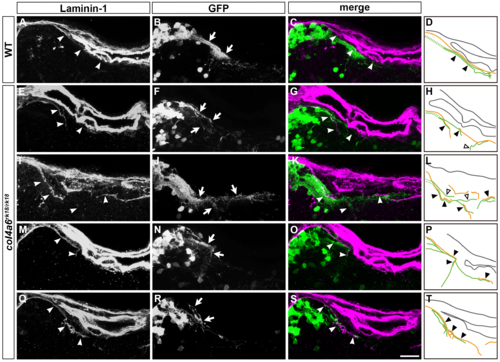
Abnormal BM structure is coupled with the abnormal axogenesis of GCs in col4a6 mutants. Wild-type (A-D) and col4a6 mutant (E-H) transgenic larvae that express GFP in the GC (hspGFFDMC90A; UAS:GFP) were stained at 5 dpf with anti-GFP (green) and anti-laminin–1 (magenta) antibodies. Dorsal projection views (A, E); 9.723-μm-thick projection views (B-D, F-H). (I, J) Schematic representation of BM (brown) and GC axons (green) in wild-type (A-D) and the col4a6 mutant (E-H) hindbrain. The laminin–1+ BM structure was split into two layers in the col4a6 mutant (indicated by arrows in G). In the same region, the corresponding GC axons were bifurcated, some of the axons ran along the split BM layers (indicated by arrowheads in F and H, by closed triangles in J) and some of them did not run along the BM layer (indicated by open triangles in J). The root of the GC axons cannot be distinguished from one another and thus is described by a dotted line. Scale bars: 20 μm in E (applied to A); 20 μm in H (applied to B, C, D, F, G). |
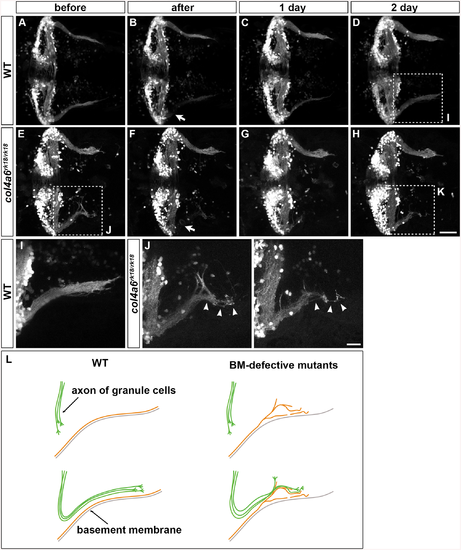
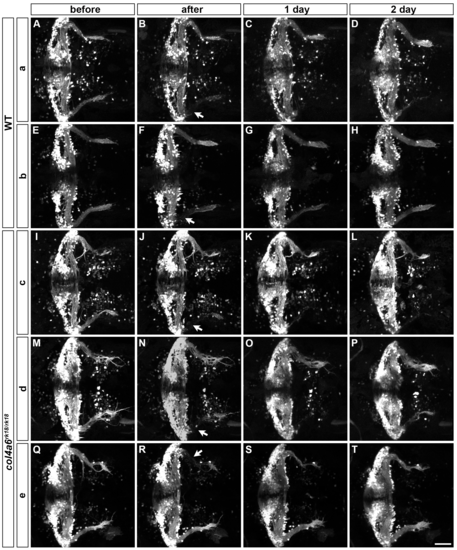
Abnormality in regenerating GC axons is linked to the abnormal BM structure in col4a6 mutants. The axons of caudolateral GCs in wild-type and col4a6 mutant larvae harboring the hspGFFDMC90A (GC-specific Gal4) and UAS:GFP transgenes were ablated by a laser on the left side (marked by arrows) at 5 dpf. The GC axons of the larvae were observed before (A, E), soon after (B, F), or 1 (C, G) or 2 days (D, H) after the laser ablation. Dorsal views of the rostral hindbrain regions. (I, J, K) High-magnification images of boxes I (in D), J (in E), and K (in H). Some of the regenerated axons followed the same abnormal routes that were used by the original axons in the col4a6 mutant (indicated by arrowheads in J and K). (L) Schematic representation of the axogenesis of caudolateral GCs in wild-type and BM mutant (col4a5 and col4a6) larvae. Scale bars: 50 μm in H (applied to A-G); 20 μm in K (applied to I, J). (See more examples in S5 Fig). |
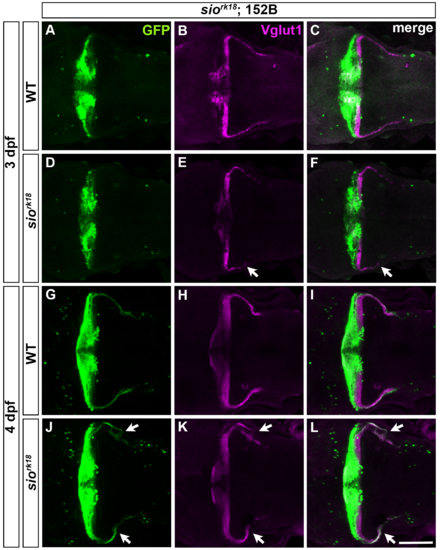
Abnormal GC axons in GC-specific Gal4 line gSA2AzGFF152B in sio mutants. Labeling of the caudolateral GCs in 3-dpf (A-F) and 4-dpf (G-L) wild-type (WT, A-C, G-I) and siork18 mutant (D-F, J-L) larvae with gSA2AzGFF152B; UAS:GFP (anti-GFP, green, A, C, D, F, G, I, J, L) and anti-Vglut1 (magenta, B, C, E, F, H, I, K, L) antibodies. Dorsal views with anterior to the left. Abnormal axons are indicated by arrows. Scale bars: 100 μm in L (applied to A-K). |
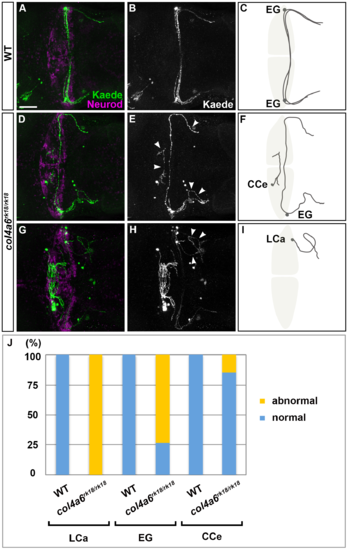
Sparse cell labeling of GC axons in col4a6 mutants. Sparse cell labeling was performed by injecting UAS:Kaede reporter DNA and Tol1 transposase RNA into the GC-specific Gal4 line hspGFFDMC90A. Immunostaning with anti-Kaede (A, B, D, E, G, H) and anti-Neurod antibodies (A, D, G). 5-dpf wild-type (A, B) and col4a6 (D, E, G, H) larvae. Dorsal views. Arrowhead shows abnormal GC axons (E, H). (C, F, I) Schematic drawing of normal GC axons (C) and typical abnormal axons of GCs in LCa (I), EG and CCe (F). (J) Percentage of abnormal and normal GC axons in wild-type and the col4a6 mutant larvae. Statistic analysis is shown in S1 Table. The GC axons were significantly affected in the col4a6 mutant larvae, compared to wild-type larvae (Fisher’s exact test p<0.01 for LCa and EG, and p<0.05 for CCe). Most of the GC axons from the LCa and EG displayed misorientation, whereas only a portion of the GC axons in the CCe were affected. Scale bars: 50 μm in A (applied to B, D, E, G, H). |
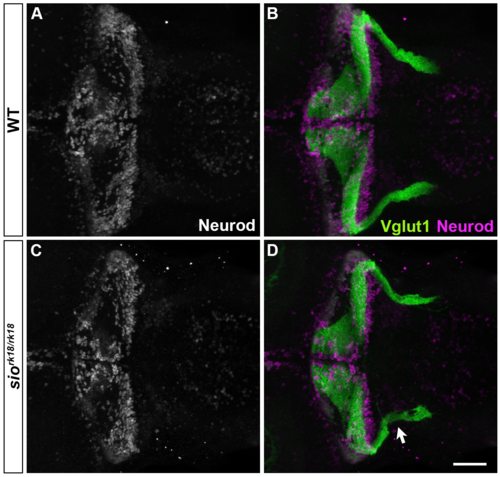
GC differentiation is not affected in sio mutants. Wild-type (A, B) and sio mutant (C, D) larvae were stained with anti-Neurod (white in A and C, magenta in B, D) and anti-Vglut1 (green, B, D) antibodies, which mark the nuclei and axons, respectively, of the GCs. Although the axons of the caudolateral GCs were affected in the sio mutants (marked by arrow in D), the expression of Neurod was not significantly affected in the mutants. Scale bars: 50 μm in D (applied to A-C). |
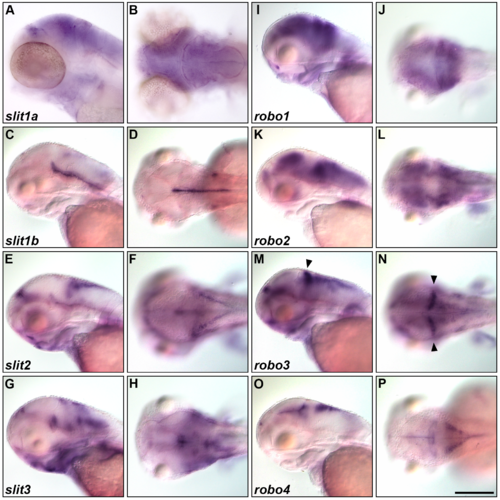
Expression of slit and robo genes. Expression of slit1a (A, B), slit1b (C, D), slit2 (E, F), slit3 (G, H), robo1 (I, J), robo2 (K, L), robo3 (M, N), and robo4 (O, P) at 5 dpf. The expression was examined by whole-mount in situ hybridization. Lateral (A, C, E, G, I, K, M, O) and dorsal (B, D, F, H, J, L, N, P) views. robo3 was expressed in the cerebellum (indicated by arrowheads, M, N). Scale bars: 200 μm in P (applied to A-O). |
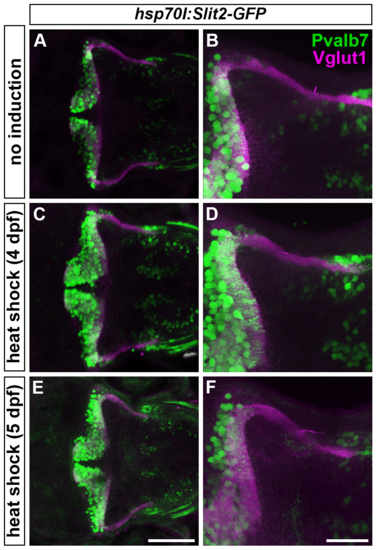
Overexpression of Slit2-GFP at 4 or 5 dpf does not affect GC axogenesis. Slit2 was overexpressed at 4 (C, D) or 5 dpf (E, F) by heat shock using the hsp70l:Slit2:GFP line. The resultant larvae were fixed at 5 dpf and stained with anti-parvalbumin7 (Pvalb7, green) and anti-Vglut1 (magenta) antibodies. (A, B) Non-induced control. Dorsal views. (B, D, F) High-magnification views of (A, C, E). Scale bars: 100 μm in E (applied to A, C); 40 μm in F (applied to B, D). |
HNK–1 epitopes are sparsely distributed in the tectal BM region of col4a6 mutants. Wild-type (A-D) and col4a6 mutant (E-H) larvae were stained with anti-HNK–1 (zn12, A, B, D, E, F, H) and anti-GFP (A, C, D, E, G, H) antibodies. The RGC axons marked by pou4f3:Gal4; UAS:GAP-GFP in the tectal region; dorsal projection views (A, E) and lateral views (B-D, F-H). The HNK–1+ region was thinker in the tectal BM of the col4a6 mutants (n = 5), compared to that in the wild type larvae (n = 3). The statistic analysis is shown inS4 Table. Scale bars: 20 μm in H (applied to A-G). |
BM structure is disrupted in the col4a6 and col4a5 mutant tectum. Tectum of 5-dpf wild-type (G-I), col4a6 mutant (A-F), and col4a5 mutant (J-L) larvae was analyzed by electron microscopy. Cross sections (A, G, J). (B) Higher magnification view of box B in (A). (C, D) Higher magnification views of boxes C and D in (B). (E, F) Higher magnification views of boxes E and F in (D). (H) Higher magnification view of box H in (G). (I) Higher magnification view of box I in (H). (K) Higher magnification view of box K in (J). (L) Higher magnification view of box L in (K). The BM is indicated by yellow arrowheads. Truncation of the tectal BM was observed in both col4a6 and col4a5 mutants. Axons containing synaptic vesicles and microtubules are marked by blue and green dashed circles, respectively. Scale bars: 20 μm in A; 10 μm in B, G and J; 2 μm in C, O, H and K; 0.5 μm in E, F, I and L. |
Abnormal GC axons are coupled with abnormal BM in the col4a6 mutant hindbrain. The GC axons and BM structures in the hindbrain of wild-type (n = 2) and col4a6 mutant larvae (n = 5) were analyzed as described in Fig 7. Typical examples were shown in Fig 7, and the rest of the samples (one) for WT and four for the mutant) are shown in this figure. Laminin–1 (A, E, I, M, Q), GFP (B, F, J, N, R), and merged images (C, G, K, O, S). Hindbrain BM and caudolateral GC axons are indicated by arrowheads and arrows, respectively. (D, H, L, P, T) Schematic representation of the BM (brown) and GC axons (green). GC axons that ran along the BM are indicated by closed triangles. GC axons that did not run along the BM are indicated by open triangles. Scale bars: 20 μm in S (applied to A-C, E-G, I-K, M-O, Q-R). |
Laser ablation of GCs. Axons of caudolateral GCs in wild-type (2 larvae: a, b) and col4a6 mutant (3 larvae: c-e) larvae that harbored hspGFFDMC90A; UAS:Kaede (a, c, d) or hspGFFDMC90A; UAS:GFP (b, e) transgenes were ablated by a laser at 5 dpf. The GC axons of the larvae were observed before (A, E, I, M, Q), soon after (B, F, J, N, R), or 1 (C, G, K, O, S) or 2 days (D, H, L, P, T) after the laser ablation. The experimental conditions were the same as described in the legend for Fig 8. More examples are shown in this figure. Dorsal views of the rostral hindbrain regions. The ablation points are indicated by arrows (B, F, J, N, R). Scale bars: 50 μm in T (applied to A-S). |
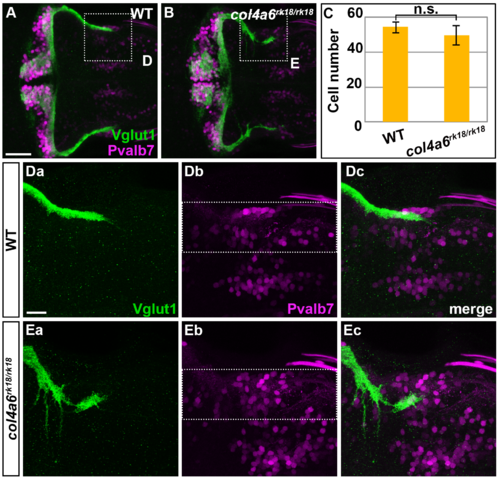
Crest cells are not affected in col4a6 mutants. Immunostaining of 5-dpf wild-type (A, Da-Dc) and col4a6 mutant (B, Ea-Ec) larvae with anti-Vglut1 (A, B, Da, Dc, Ea, Ec) and anti-Pvalb7 (A, B, Db, Dc, Eb, Ec) antibodies. Higher-magnification images of boxes D and E in A (Da-Dc, Ea-Ec). The number of crest cells in each larva is indicated (C). The number of crest cell is not significantly different between wild-type and col4a6 mutants (n.s., Student’s t-tests p = 0.504). Scale bars: 50 μm in A (applied to B), 20 μm in Da (applied to Db-Gc). |
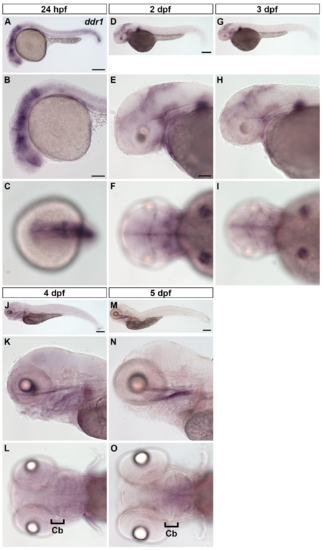
Expression of ddr1. Expression of ddr1 (A-O) at 24 hpf (A, B, C), 2 dpf (D, E, F), 3 dpf (G, H, I), 4 dpf (J, K, L), and 5 dpf (M, N, O). The expression was examined by whole-mount in situ hybridization. Lateral (A, B, D, E, G, H, J, K, M, N) and dorsal (C, F, I, L, O) views. Cb: cerebellum region. Scale bars: 200 μm in A, D (applied to G), J, M: 100 μm in B (applied to C), 100 μm in E (applied to F, H, I, K, L, N, O). |
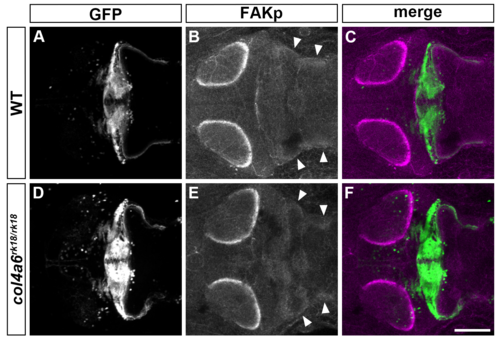
Col4a6-independent FAK activation in GC axons. Immunostaining of 5-dpf wild-type (A-C) and col4a6 (D-F) mutant larvae harboring the gSA2AzGFF152B; UAS:GFP transgene with anti-GFP (granule cell axons, A, C, D, F) and anti-phosphorylated FAK (B, C, E, F) antibodies. Dorsal views of the rostral hindbrain region. Note that the phosphorylated (active) form of FAK was similarly detected in the caudolateral GC axons in the wild-type and col4a6 mutant hindbrain (marked by arrowheads). Scale bar: 100 μm in F (applied to A-E). |
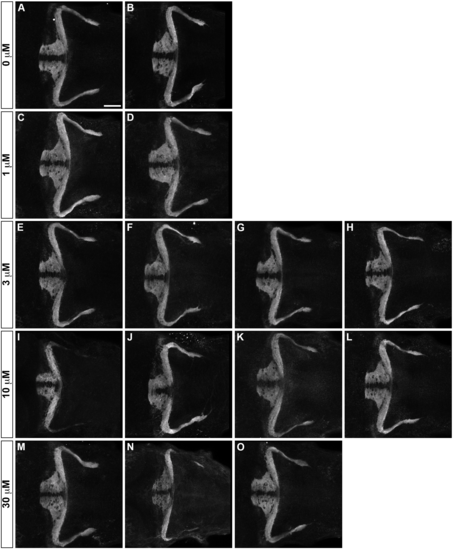
Inhibition of FAK does not affect formation of GC axons. Effect of an FAK inhibitor PF–573228 on axogenesis of GC axons. Wild-type larvae were untreated (A, B, 1% DMSO) or treated with 1 μM (C, D), 3 μM (E-H), 10 μM (I-L) and 30 μM (M-O) PF–5773228 (in 1% DMSO) from 10 hpf to 5 dpf. The resultant 5-dpf larvae were stained with anti-Vglut1 antibody. IC50 (half maximal inhibitory concentration) of PF–573228 is 30–100 nM [46] and 10 μM of PF–573228 was reported to sufficiently inhibit FAK in zebrafish embryos [45]. Scale bars: 100 μm in A (applied to B-O). |