
- Title
-
Pleiotropic effects of Sox2 during the development of the zebrafish epithalamus
- Authors
- Pavlou, S., Astell, K., Kasioulis, I., Gakovic, M., Baldock, R., van Heyningen, V., and Coutinho, P.
- Source
- Full text @ PLoS One
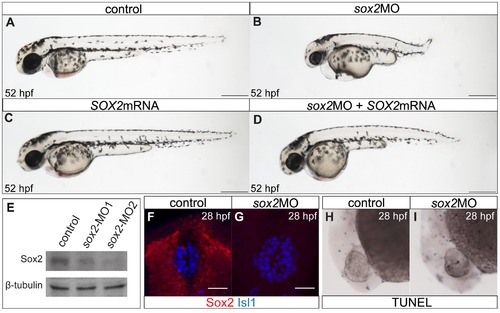
The zebrafish sox2 morphant model. (A) Lateral view of control embryo at 52 hpf. (B) sox2 morphants have small eyes and short body axis in relation to control siblings. (C) Microinjections with SOX2 mRNA have no phenotypic effect, while (D) mRNA injections into sox2 morphants rescue the phenotypes. (E) Western blot showing the reduction in the levels of Sox2 in embryos injected with sox2-MO1 (second column) and sox2-MO2 (third column), when compared to controls (first column). β-tubulin was used as loading control. (F) Whole mount immunofluorescence for Sox2 (red) and Isl1 (blue) shows that Sox2 is expressed in the epithalamus, but not in the differentiated pineal cells at 28 hpf. (G) Sox2 is undetectable by immunofluorescence in sox2 morphants, at 28 hpf. (H?I) Morpholino microinjections do not grately affect apoptosis, as judged by TUNEL assay at 28 hpf. (A?D) scale bars = 250 μm, (F?G) scale bars = 25 μm. See also Figure S1. |
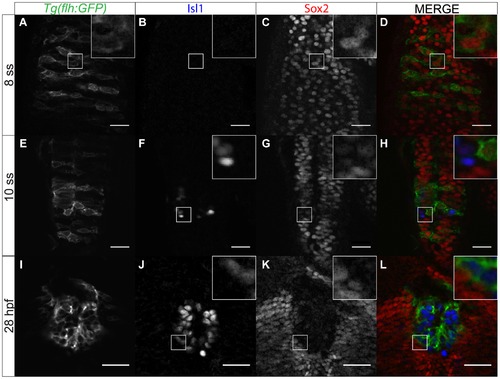
Sox2 expression within the pineal anlage is downregulated with differentiation. (A?D) Sox2 expression overlaps with expression of flh, a marker for pineal precursors, at 8 ss. (E?H) As pineal cells start differentiating, Isl1 is upregulated whereas Sox2 is downregulated. Yellow arrows show cells that have both Isl1 and Sox2 expression at low levels. (I?L) Sox2 is absent from the fully differentiated pineal cells. Scale bars = 25 μm, optical sections from confocal microscopy, insets show a three times magnified view of the image, (E,I,M) GFP expression of Tg(flh:GFP) (F,J,N) immunofluorescence for Isl1, (G,K,O) immunofluorescence for Sox2, (H,L,P) merged images with Tg(GFP:flh) in green, Isl1 in blue and Sox2 in red, developmental stages are shown at the beginning of each row. EXPRESSION / LABELING:
|
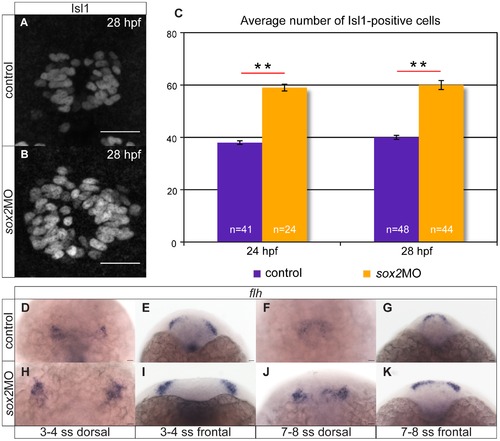
Knockdown of sox2 results in upregulation of neurogenesis. (A?B) Neurogenesis is increased in sox2 morphants, as judged by Isl1 expression. (C) Average number of Isl1-positive cells in control (purple bar) and sox2 morphants (orange bar), at 24 and 28 hpf. (D?E) At 3?4 ss, two flh-domains are observed on either side of the neural plate. (F?G) By 7?8 ss, the two domains fuse to form the presumptive pineal gland. (H?K) In sox2 morphants, flh is expressed in broader domains in relation to control siblings. Scale bars = 25 μm, (A?B) confocal maximum projections, (C) error bars represent ± standard error, ** = p-value <0.001 (MWU test). (J,L,N,P) dorsal views with anterior to the top, (K,M,O,Q) frontal views. See also Figure S2?S3. EXPRESSION / LABELING:
|
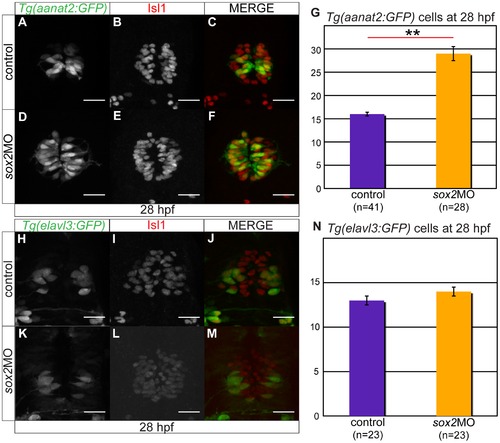
C) Tg(aanat2:GFP) drives GFP expression in the pineal PhRs. (B) Isl1 labels the pineal cells. (D?F) Knockdown of sox2 results in increased number of PhRs. (G) The average number of PhRs in control (purple bar) and sox2 morphants (orange bar). (H?J) Tg(elavl3:GFP) drives GFP expression specifically in the PNs. (K?M) The knockdown of sox2 does not affect the number of PNs. (N) The average number of PNs in controls (purple bar) and sox2 morphants (orange bar) does not significantly differ. Confocal maximum projections of 28 hpf embryos, scale bars = 25 μm, error bars represent ± standard error, ** = p-value <0.001 (MWU test). See also Figure S4. |
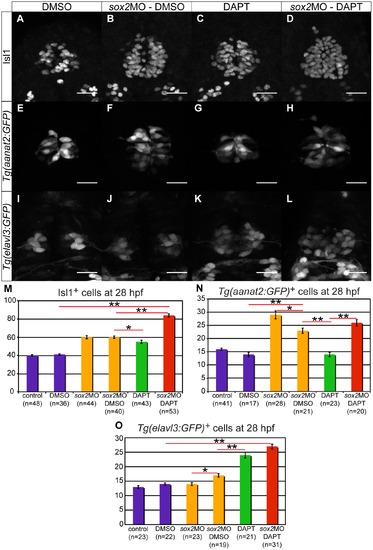
Sox2 and Notch have synergistic effect on neurogenesis and complementary effects on cell-fate determination. (A?D) The number of pineal neurons (Isl1-positive cells) is increased in sox2 morphants (B) and in DAPT-treated embryos (C), when compared to DMSO-treated controls (A). A synergistic effect is observed when both sox2 and Notch are knocked down (D). (E?H) Tg(aanat2:GFP) drives GFP expression in the pineal PhRs in DMSO-treated controls (E). The number of PhRs is increased in sox2 morphants (F), but remains unaffected in DAPT-treated embryos (G). The knockdown of both sox2 and Notch results in an increased number of GFP-positive cells (H), comparable to the one observed in sox2 morphants. (I?L) Tg(elavl3:GFP) expresses GFP in PNs. There is no difference in the number of GFP-positive in sox2 morphants (I) when compared to DMSO-treated controls (I). The knockdown of Notch alone (K) or simultaneously with sox2 (L) results in similar increase in GFP expression. (M?O) Average number of Isl1-positive cells (M), PhRs (N) and PNs (O) in untreated controls, DMSO-treated controls, untreated sox2 morphants, DMSO-treated sox2 morphants, DAPT-treated embryos and DAPT-treated sox2 morphants. Confocal maximum projections of 28 hpf embryos, scale bars = 25 μm, error bars represent ± standard error, * = p-value <0.05 (MWU test), ** = p-value <0.001 (MWU test). See also Figure S5?S7 and Movie S1?S2. |
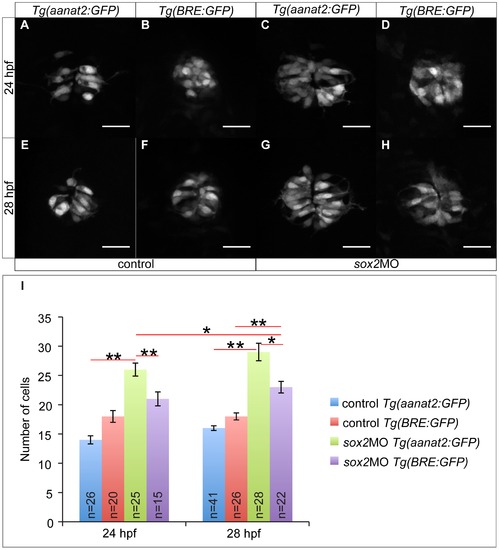
Sox2 controls PhR cell fate independently of BMP. (A) The transgenic line Tg(aanat2:GFP) marks the PhRs. (B) The transgenic line Tg(BRE:GFP) is as a BMP signaling reporter. (C) In sox2 morphant embryos, the number of PhRs is increased at 24 hpf, when compared to controls (A). (D) The number of BMP-responsive cells at 24 hpf is unaffected when sox2 is knocked down. (E?F) The number of PhRs (E) and BMP-responsive cells (F) is similar in control embryos at 28 hpf. (G?H) The number of PhRs (G) is higher than the number of BMP-responsive cells (H) at 28 hpf, in sox2 morphants. (I) The average number of PhRs (Tg(aanat2:GFP)-positive cells) and BMP-responsive cells (Tg(BRE:GFP)-positive cells) in control and sox2 morphant embryos, at 24 and 28 hpf. Confocal maximum projections, scale bars = 25 μm, error bars represent ± standard error, ** = p-value <0.001 (MWU test). See also Figure S8 and Movie S3. |
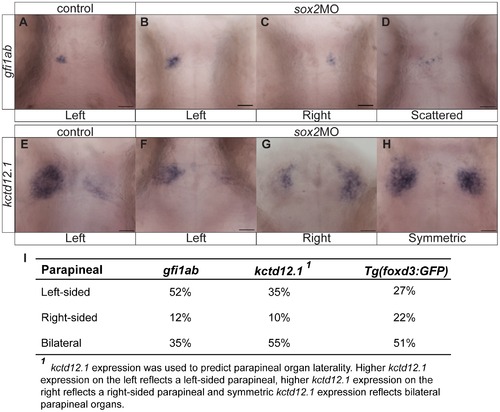
Knockdown of sox2 results in abnormal parapineal development and disruption of the habenular asymmetries. (A) gfi1ab is expressed in parapineal cells on the left side of the brain in control embryos. (B?D) sox2 morphants are categorized into three groups according to gfi1ab expression: left-sided expression (B), right-sided (C) and embryos with scattered gfi1ab cells (D). (E) kctd12.1 is asymmetrically expressed in the habenulae, with a broader expression domain in the left than the right habenula. (F?H) In sox2 morphants kctd12.1 expression can be: asymmetric with more on the left side similar to control embryos (F), asymmetric with more on the right side (G) or symmetric (H). (I) A table showing the percentage of embryos with normal, reversed or bilateral parapineal organs, using different staining methods. Scale bars = 25 μm. See also Figure S9?S10 and Movie S4. |
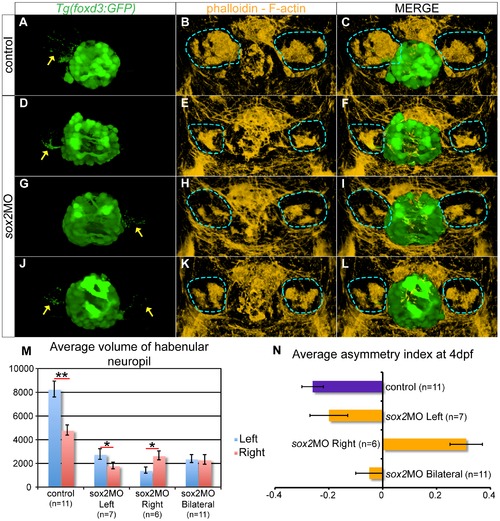
The parapineal and habenular defects are coupled in sox2 morphants. (A?C) In control embryos, the left-sided parapineal projects towards the left habenula. As a result, the left habenula has denser neuropils than the right, as judged by phalloidin staining. (D?F) In sox2 morphants with left-sided parapineal projections, the left habenula is larger than the right. (G?I) Morphants with right-sided parapineal organs display reverse habenular asymmetries, whereas (J?L) morphants with bilateral parapineal projections have symmetric habenulae. (M) The average volume of the left (blue bars) and right (red bars) habenular neuropils, as judged by the volume of phalloidin-positive areas within the habenulae. y-axis show volume in µm3. (N) Average asymmetry index in control (purple bar) and sox2 morphants (orange bars). 3D reconstructions of confocal images at 4 dpf, arrows show parapineal projections and blue lines surround the habenular neuropils, error bars represent ± standard error, (M) * = p-value <0.05 and ** = p-value <0.001 (Wilcoxon test). EXPRESSION / LABELING:
|
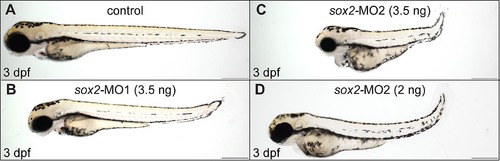
The severity of the phenotypes observed in sox2 morphants varies between different morpholinos and it is concentration dependent. (A) Lateral view of a control embryo at 3 dpf. (B) Microinjections with 3.5 ng sox2-MO1 morpholino result in a mild phenotype. (C) Microinjections with 3.5 ng sox2-MO2 result in a more severe phenotype. (D) Microinjections with 2 ng of sox2-MO2 result in a mild phenotype. See also Figure 1. |
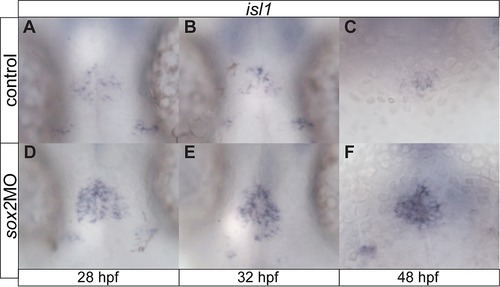
sox2 modulates neurogenesis within the pineal gland. (A?C) isl1 is expressed in epiphysial neuronal cells at 28, 32 and 48 hpf. (D?F) Knockdown of sox2 results in increased isl1 expression, suggesting an increase in neurogenesis. See also Figure 3. |
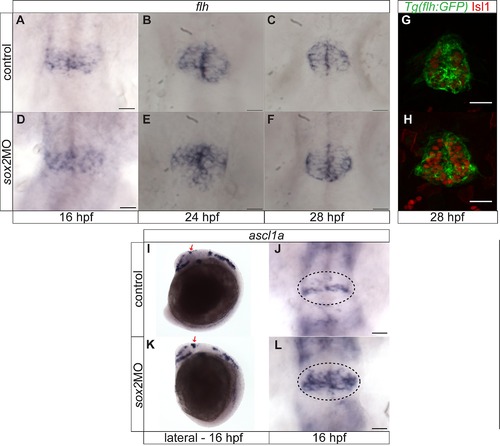
ascl1a is upregulated in sox2 morphants. (A?F) Between 16 and 28 hpf, flh expression is indistinguishable between control (A?C) and sox2 morphant siblings (D?F). (G?H) Similarly, no difference was observed in GFP expression of the Tg(flh:GFP) (green) between control and sox2 morphant embryos at 28 hpf. Isl1 (red) was used to mark the pineal gland. (I?J) ascl1a is expressed within the presumptive pineal gland (red arrows and circles) at 16 hpf in control embryos. (K?L) In sox2 morphants, ascl1a expression is upregulated at 16 hpf. Developmental stages are shown at the bottom of each column, scale bars = 25 μm, (A?H, J, L) Dorsal views, (I,K) Lateral views, (G,H) confocal maximum projections. See also Figure 3. |
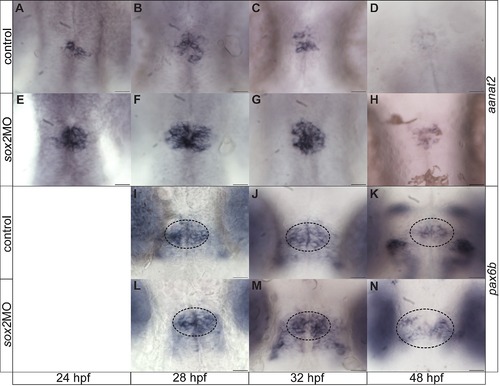
sox2 controls the PhR cell fate. (A?D) aanat2 is expressed in the photoreceptors between 24 and 48 hpf, as detected by whole mount in situ hybridization. (E?H) At all stages analyzed, an upregulation of aanat2 expression is observed in sox2 morphants when compared to control siblings. (I?K) pax6b is expressed in the projection neurons and a subset of pineal precursors from 28 hpf to 48 hpf. (L?N) Downregulation of sox2 does not affect the number of pax6b-positive cells. At 48 hpf, pax6b is expressed in a broader domain in sox2 morphants when compared to control siblings. Developmental stages are shown at the bottom of each column, scale bars = 25 µm. See also Figure 4. |
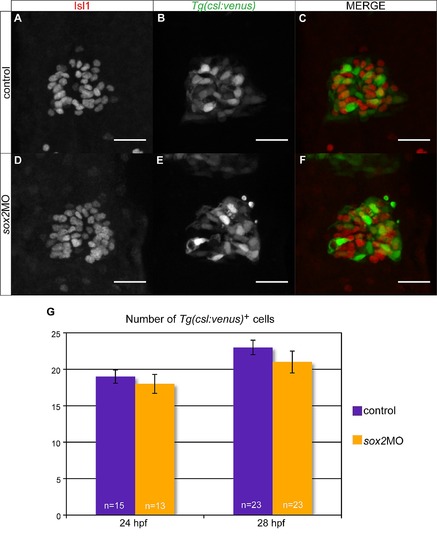
Downregulation of sox2 does not affect Notch activity within the pineal gland. (A?C) Tg(csl:venus) is a Notch reporter line and drives venus expression (B) within the pineal gland, which is marked by isl1 antibody staining (A). Only about 50% of venus-expressing cells are positive for isl1. (D?F) Microinjections with sox2 morpholinos have no effect on Notch activity, as shown by venus expression. (G) Average number of total venus-positive cells (venus+/isl1+ and venus+/isl) in control (purple bars) and sox2 morphants (orange bars) at 24 and 28 hpf. Confocal maximum projections, scale bars = 25 µm, error bars represent ± standard error, MWU test; not significant; p-value >0.05, number of embryos counted is shown in each bar. See also Figure 5, Figure S6?S8 and Movie S1?S2. |

Downregulation of Notch results in more isl1+/sox2 cells in relation to controls. (A-E′′) sox2 is expressed throughout the pineal anlage and is downregulated in isl1-positive cells, in DMSO-treated control embryos at 15 ss. (A-E) sox2 expression, (A′-E′) isl1 expression, (A′′-E′′) merged images of sox2, isl1 and Tg(flh:GFP) that marks the pineal anlage. (F′-J′′) DAPT treatment results in increased number of cells expressing isl1 (F′-J′). sox2 (F-J) is still expressed in the undifferentiated pineal precursor cells (green in F′′-J′′) but not in the differentiated isl1-positive cells (F′-J′). Since there are more isl1-positive cells, sox2 is downregulated in a broader domain in relation to controls. Series of optical sections from dorsal (first column) to ventral (5th column) obtained using confocal microscope, scale bars = 25 μm, yellow arrows show cells in which sox2 is downregulated and isl1 is upregulated, insets show a three times magnified view of the image. See also Figure 5, Movie S1. |
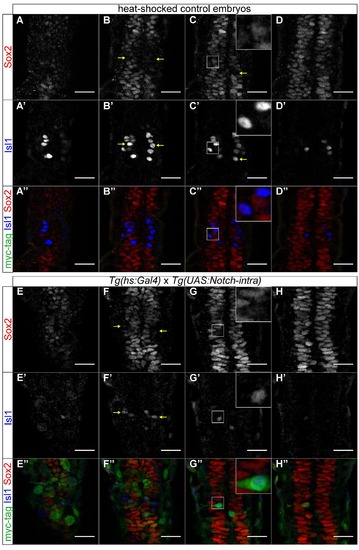
Upregulation of Notch results in a broader domain of sox2 expression, at 20 ss. (A-D′′) sox2 is expressed throughout the pineal anlage and is downregulated in isl1-positive cells, in heat-shocked control embryos, at 20 ss. (A-D) sox2 expression, (A′-D′) isl1 expression, (A′′-D′′) merged images of sox2, isl1 and myc-tag, showing that heat-shock did not activate the Notch1a intracellular domain. (E-H′′) Heat-shock of the double transgenics Tg(hs:Gal4); Tg(UAS:Notch-intra) results in fewer isl1-positive cells (E′-H′) and therefore sox2 is expressed in a broader domain (E-H). (E′′-H′′) Merged images of sox2, isl1 and myc-tag, showing the activation of the transgene and thus the upregulation of Notch. Series of optical sections from dorsal (first column) to ventral (4th column) obtained using confocal microscope, scale bars = 25 μm, yellow arrows show cells in which sox2 is downregulated and isl1 is upregulated, insets show a three times magnified view of the image. See also Figure 5, Movie S2. |
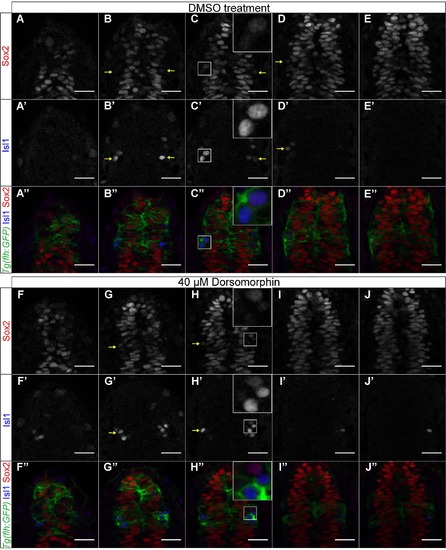
Downregulation of BMP does not affect sox2 expression at 15 ss. (A-E′′) sox2 is expressed throughout the pineal anlage and is downregulated in isl1-positive cells, in DMSO-treated control embryos. (A-E) sox2 expression, (A′-E′) isl1 expression, (A′′-E′′) merged images of sox2, isl1 and Tg(flh:GFP), showing the presumptive pineal gland. (F-J′′) Dorsomorphin treatment (40 µM) does not affect sox2 expression at 15 ss. sox2 is expressed in the pineal precursors and is downregulated with differentiation (as shown by isl1-positive cells). (F-J) sox2 expression, (F′-J′) isl1 expression, (F′′-J′′) merged images of sox2, isl1 and Tg(flh:GFP). Series of optical sections from dorsal (first column) to ventral (5th column) obtained using confocal microscope, scale bars = 25 µm, yellow arrows show cells in which sox2 is downregulated and isl1 is upregulated, insets show a three times magnified view of the image. See also Figure 6, Movie S3. |
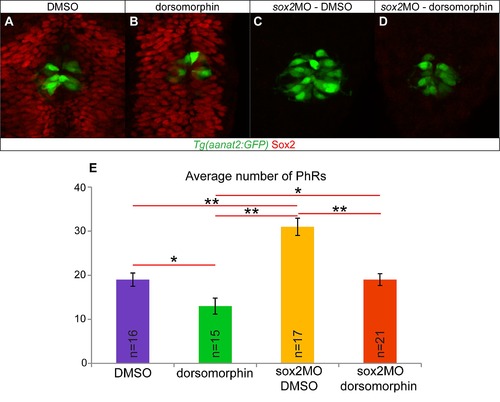
Simultaneous knockdown of sox2 and BMP rescues the number of PhRs. (A) DMSO-treated control embryos at 28 hpf, with PhR in green (Tg(aanat2:GFP)) and Sox2 in red. (B) Dorsomorphin treatment, that inhibits the BMP pathway, leads to a reduced number of PhRs, while Sox2 expression is normal. (C) Knockdown of sox2 leads to increased number of PhRs. (D) Simultaneous inhibition of sox2 and BMP results in a number of PhR similar to the DMSO-treated control siblings. (E) Average number of PhR in DMSO-treated (purple bar), dorsomorphin-treated (green bar), sox2 morphant treated with DMSO (orange bar) and sox2 morphant treated with dorsomorphin (red bar) embryos. Confocal maximum projections of 28 hpf embryos, error bars represent ± standard error, * = p-value <0.05 (MWU test), ** = p-value <0.001 (MWU test). |
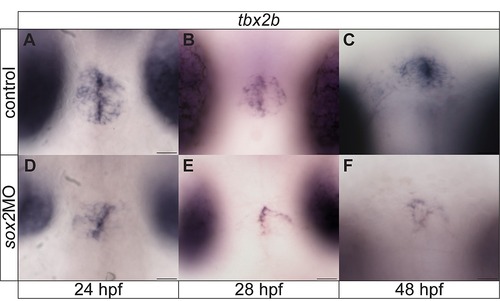
tbx2b is downregulated in sox2 morphants. (A?C) tbx2b is expressed within the pineal gland anlage and is important for the proper specification of parapineal cells. (D?F) Downregulation of sox2 results in reduced tbx2b expression at all stages analyzed. Developmental stages are shown at the bottom of each column, scale bars = 25 μm. See also Figure 7?8 and Movie S4. |
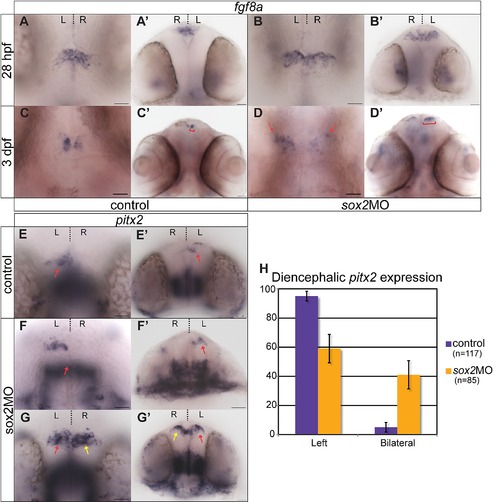
fgf8a and Nodal activity are disrupted in sox2 morphants. (A-D′) fgf8a is normally expressed bilaterally (although higher expression is detected on the left than the right) in the epithalamus, in control embryos (A-A′). As development proceeds, fgf8a expression becomes restricted to the medial part of the diencephalon (C-C′). At early stages, fgf8a expression is normal, in sox2 morphants (B-B′). However, at 3 dpf, fgf8a-positive cells are found in a broader domain when compared to control siblings (red brackets and arrows) (C-D′). (E-E′) pitx2 is normally expressed in the left side of zebrafish diencephalon (red arrow). (F-F′) Approximately 60% of sox2 morphants have normal left-sided pitx2 expression, whereas (G-G′) 40% of embryos have abnormal bilateral pitx2 expression (yellow arrows show abnormal right-sided expression). (H) Average percentage of embryos with left or bilateral pitx2 expression in controls (purple bars) and sox2 morphants (orange bars). (A-G) Dorsal views, (A′-G′) frontal views of the same embryos. Developmental stages are shown at the bottom of each column, scale bars = 25 μm, error bars represent ± standard error. See also Figure 7-8 and Movie S4. |