
|
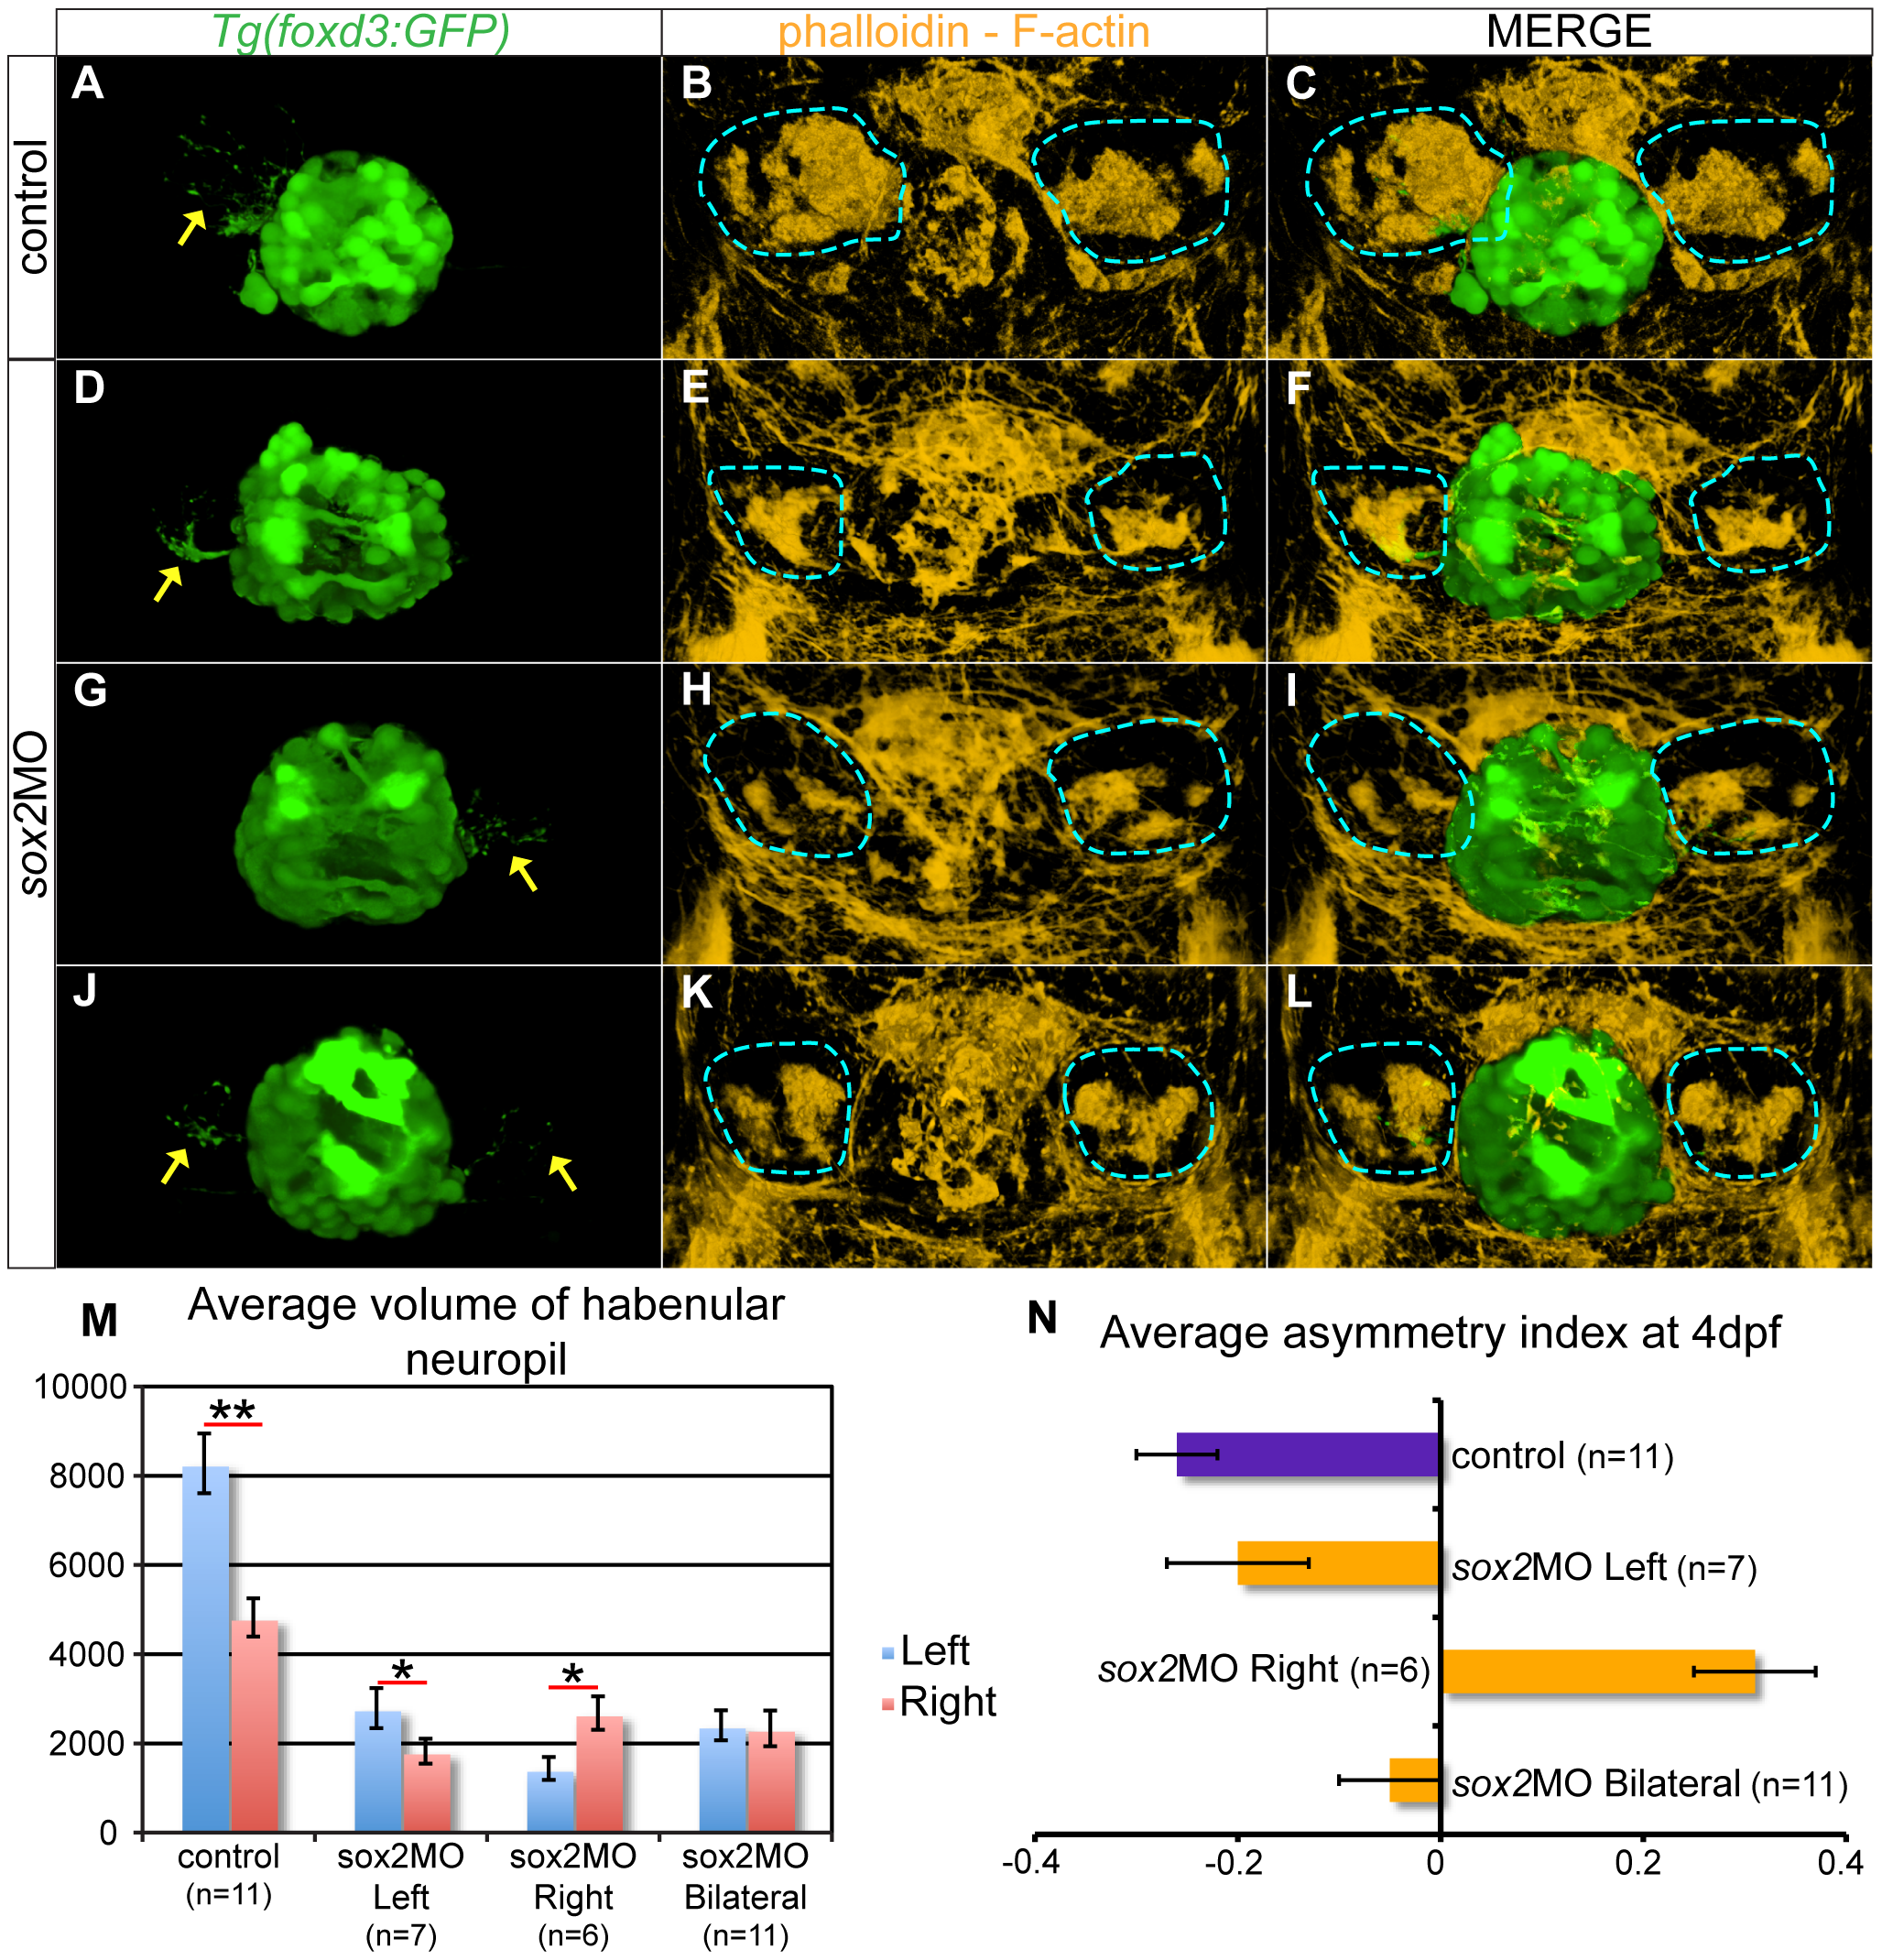
Fig. 8
The parapineal and habenular defects are coupled in sox2 morphants.
(A–C) In control embryos, the left-sided parapineal projects towards the left habenula. As a result, the left habenula has denser neuropils than the right, as judged by phalloidin staining. (D–F) In sox2 morphants with left-sided parapineal projections, the left habenula is larger than the right. (G–I) Morphants with right-sided parapineal organs display reverse habenular asymmetries, whereas (J–L) morphants with bilateral parapineal projections have symmetric habenulae. (M) The average volume of the left (blue bars) and right (red bars) habenular neuropils, as judged by the volume of phalloidin-positive areas within the habenulae. y-axis show volume in µm3. (N) Average asymmetry index in control (purple bar) and sox2 morphants (orange bars). 3D reconstructions of confocal images at 4 dpf, arrows show parapineal projections and blue lines surround the habenular neuropils, error bars represent ± standard error, (M) * = p-value <0.05 and ** = p-value <0.001 (Wilcoxon test).