
Fig. S3
- ID
- ZDB-FIG-140506-56
- Publication
- Pavlou et al., 2014 - Pleiotropic effects of Sox2 during the development of the zebrafish epithalamus
- Other Figures
- All Figure Page
- Back to All Figure Page
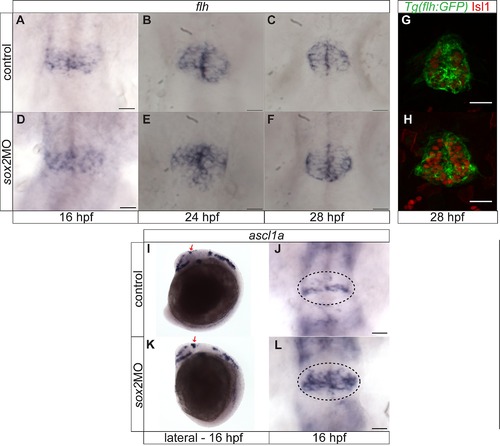
ascl1a is upregulated in sox2 morphants. (A–F) Between 16 and 28 hpf, flh expression is indistinguishable between control (A–C) and sox2 morphant siblings (D–F). (G–H) Similarly, no difference was observed in GFP expression of the Tg(flh:GFP) (green) between control and sox2 morphant embryos at 28 hpf. Isl1 (red) was used to mark the pineal gland. (I–J) ascl1a is expressed within the presumptive pineal gland (red arrows and circles) at 16 hpf in control embryos. (K–L) In sox2 morphants, ascl1a expression is upregulated at 16 hpf. Developmental stages are shown at the bottom of each column, scale bars = 25 μm, (A–H, J, L) Dorsal views, (I,K) Lateral views, (G,H) confocal maximum projections. See also Figure 3. |