
|
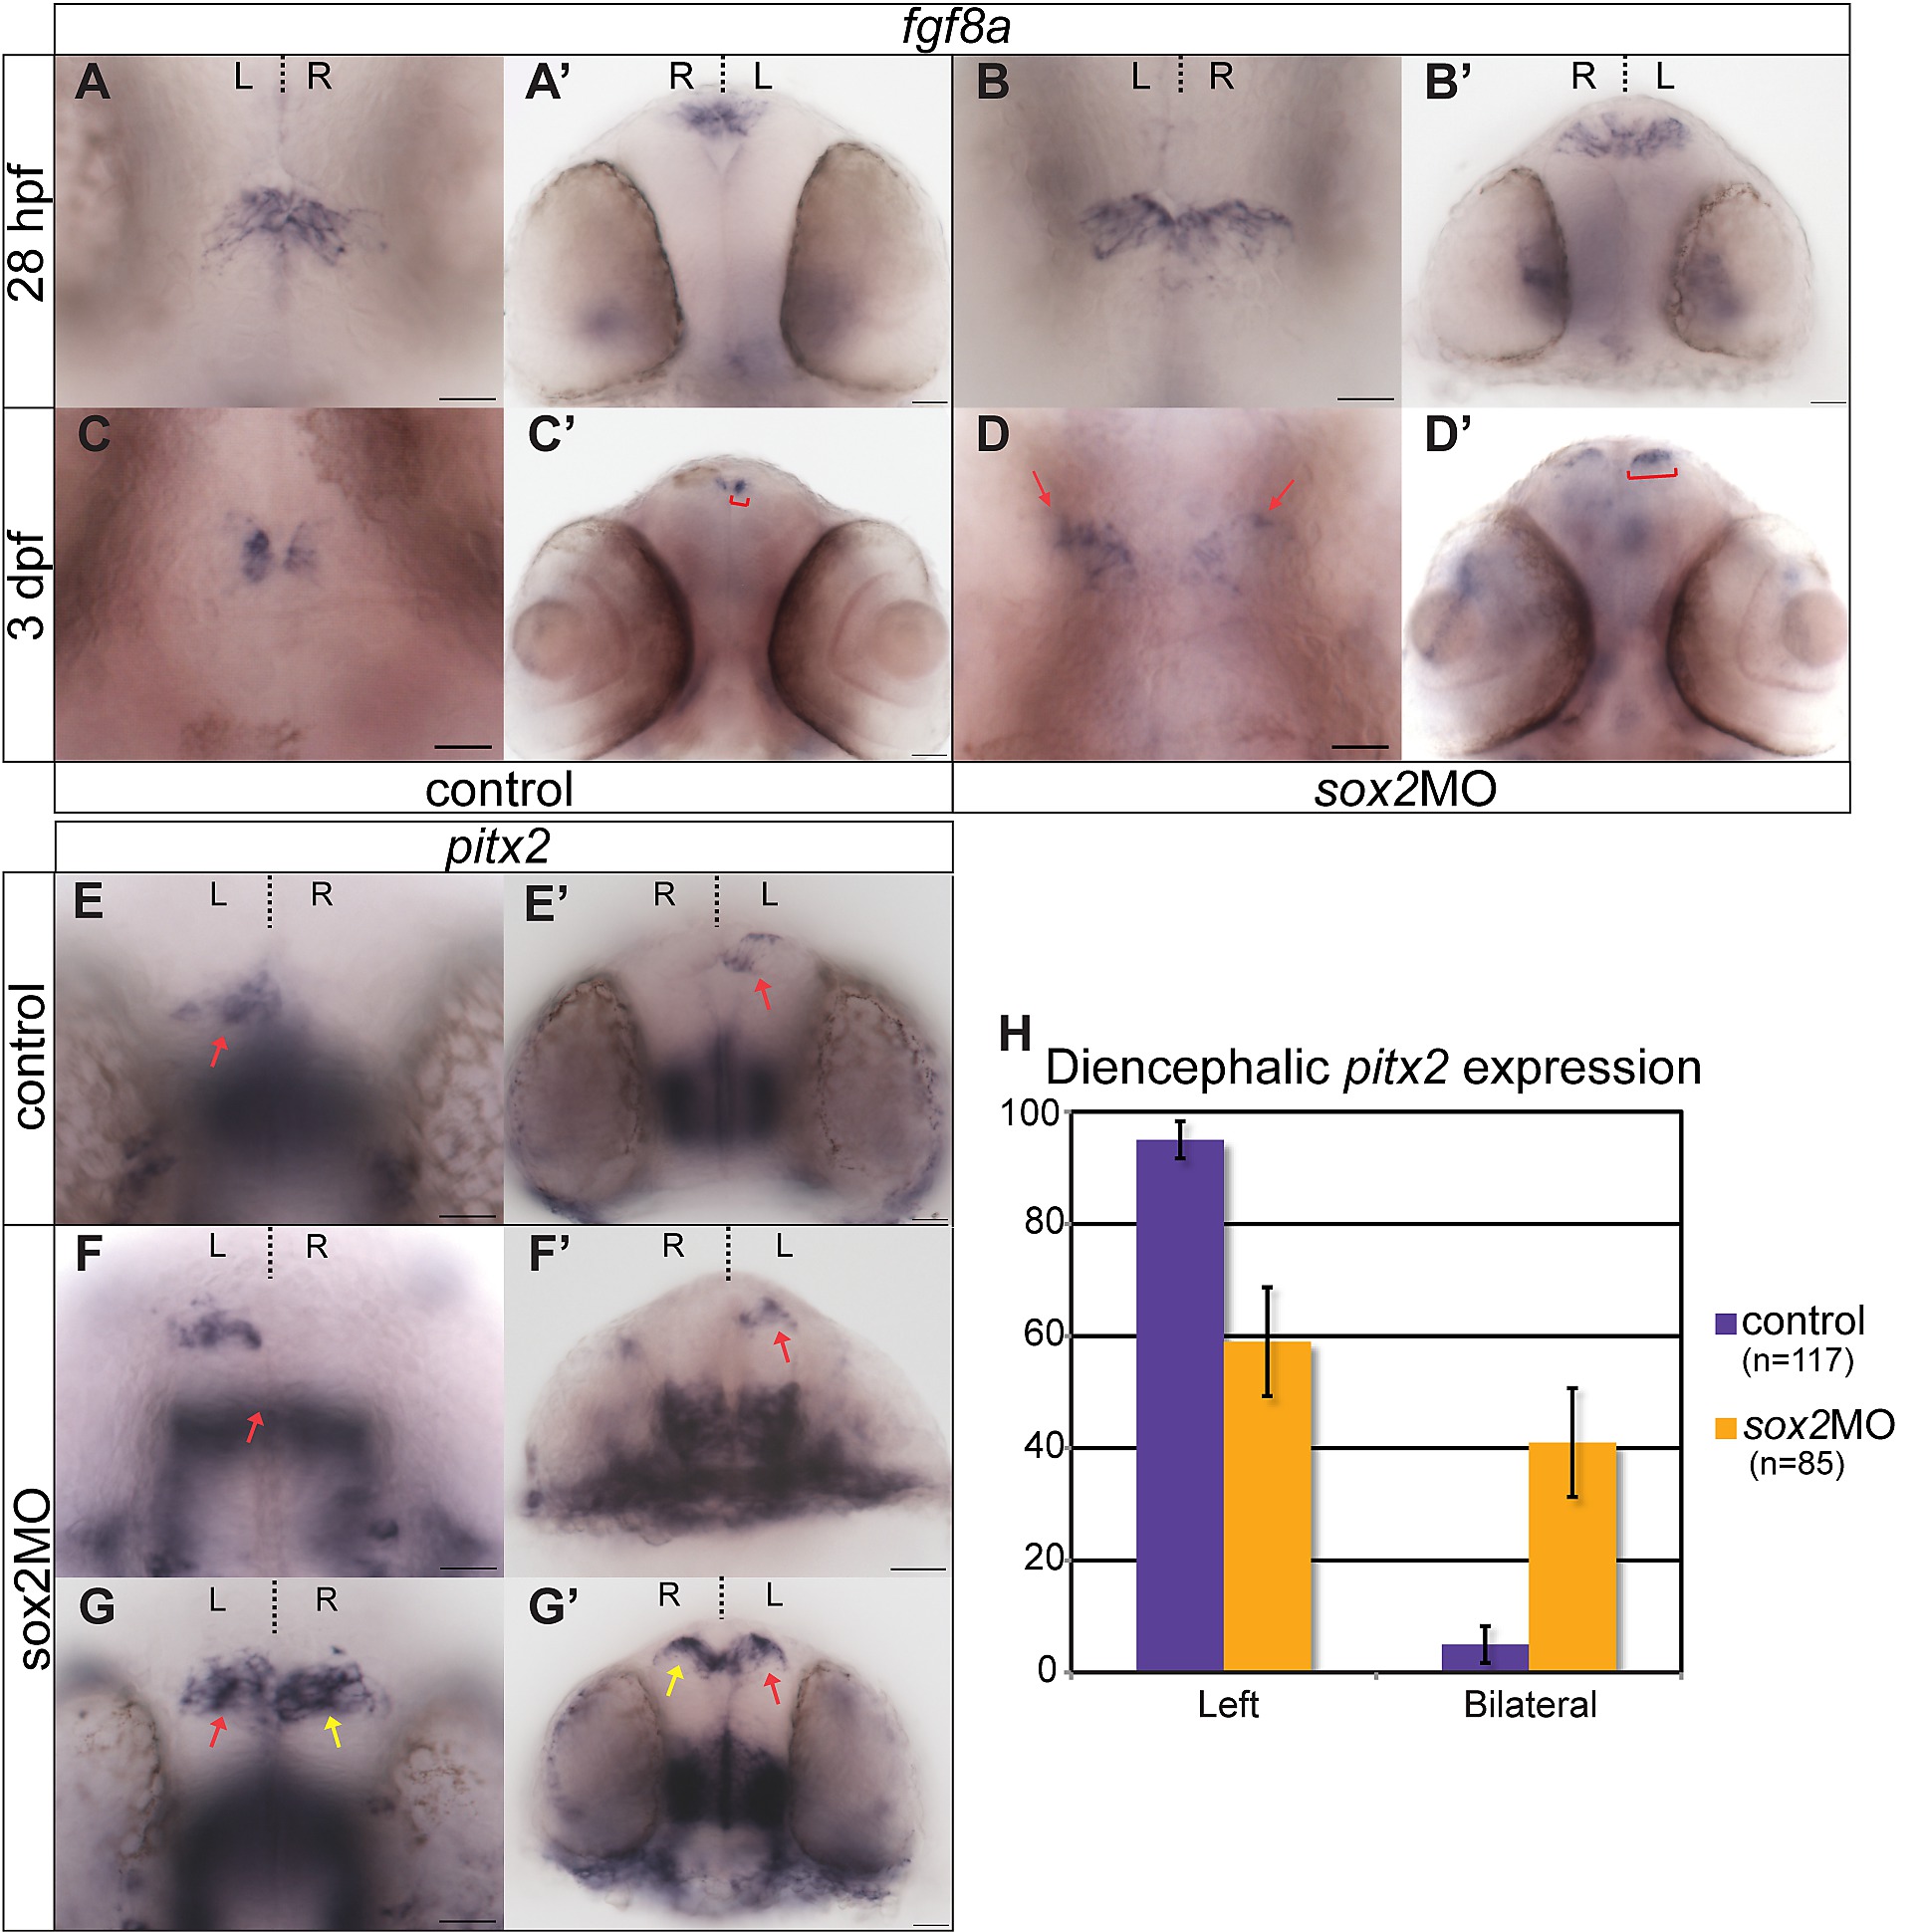
Fig. S11
fgf8a and Nodal activity are disrupted in sox2 morphants. (A-D′) fgf8a is normally expressed bilaterally (although higher expression is detected on the left than the right) in the epithalamus, in control embryos (A-A′). As development proceeds, fgf8a expression becomes restricted to the medial part of the diencephalon (C-C′). At early stages, fgf8a expression is normal, in sox2 morphants (B-B′). However, at 3 dpf, fgf8a-positive cells are found in a broader domain when compared to control siblings (red brackets and arrows) (C-D′). (E-E′) pitx2 is normally expressed in the left side of zebrafish diencephalon (red arrow). (F-F′) Approximately 60% of sox2 morphants have normal left-sided pitx2 expression, whereas (G-G′) 40% of embryos have abnormal bilateral pitx2 expression (yellow arrows show abnormal right-sided expression). (H) Average percentage of embryos with left or bilateral pitx2 expression in controls (purple bars) and sox2 morphants (orange bars). (A-G) Dorsal views, (A′-G′) frontal views of the same embryos. Developmental stages are shown at the bottom of each column, scale bars = 25 μm, error bars represent ± standard error. See also Figure 7-8 and Movie S4.