
- Title
-
Specified neural progenitors sort to form sharp domains after noisy shh signaling
- Authors
- Xiong, F., Tentner, A.R., Huang, P., Gelas, A., Mosaliganti, K.R., Souhait, L., Rannou, N., Swinburne, I.A., Obholzer, N.D., Cowgill, P.D., Schier, A.F., and Megason, S.G.
- Source
- Full text @ Cell
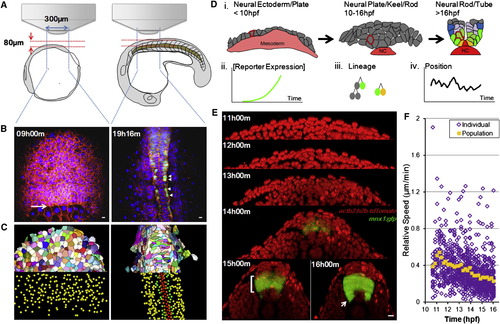
In Toto Imaging Captures Dynamics of Neural Progenitors during Neural Tube Formation in Zebrafish Embryos (A) Schematic illustration of imaging setup. See also the Extended Experimental Procedures. (B) Sample time points of raw data rendered in 3D projection dorsal view. Red indicates mem-citrine, blue designates h2b-cherry, and green shows mnx1:gfp. Arrow points to the frontier of epiboly movement. Arrowheads indicate differentiating MNs. All time annotations are hours (and minutes) postfertilization (hpf). Scale bars, 10 μm. See also Movie S1. (C) Processed data by GoFigure 2 and ACME (Mosaliganti et al., 2012) software from images in (B). Top halves: membrane segmentations (random colors to distinguish neighbors); bottom halves: nuclei segmentations for cell tracking (red indicates MFPs, orange indicates LFPs, green shows pMNs, and yellow indicates unidentified cells). (D) Schematic illustration of cell-tracking analysis. Drawings are based on cross-section images; colors are assigned based on marker expression (red: Shh; yellow: nkx2.2a; green: mnx1; blue: gata2). Part of the notochord (NC, Shh+) is included. (i) Morphogenesis during the patterning process; single cells can be tracked throughout (e.g., highlighted cell with red membrane). Tracks carry information of reporter expression (ii), lineage relationships (iii), and movement trajectories (iv). See also Figure S1 A.(E) Cross-sectional view (dorsal side up) of sample data set. Red indicates nuclei. A GFP+ stripe domain emerges (bracket, bottom-left image). Arrow points to differentiating MNs exiting the GFP domain. Scale bar, 10 μm. See also Movie S2.(F) Relative speed of cell movement during neural tube formation. Each purple mark represents the speed of a single cell; 41 tracked ventral cells are plotted. Relative speed is calculated by dividing a cell’s positional change (μm) between two time points over the time difference (11.5 min). Position is measured relative to the average position of all tracked cells to eliminate global movements introduced by embryo rotation/shifting. Orange marks show average speed. See also Figure S1F. |
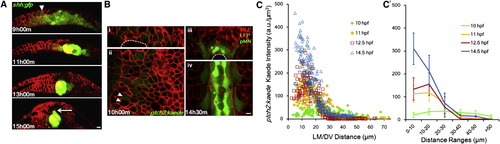
Shape Changes of Shh Gradient and Heterogeneity in Spatial Distribution of Responses (A) Time course of notochord formation by shh:gfp+ cells in cross-section. Red shows mem-mCherry (same below). Arrowhead points to GFP+ cells in neural ectoderm/plate. Arrow indicates MFP cell expressing GFP. Scale bar, 10 μm.(B) Cross-section (i and iii) and longitudinal section (ii and iv) of ptch2:kaede expression pattern. Arrowheads point to neighbor cells with different Kaede levels. Asterisks indicate stereotypic cell fates at the indicated locations. Scale bar, 10 μm. See also Figure S1A.<(C and C′) Kaede level spatial distribution through time. Each mark represents a segmented cell with measured position and fluorescence intensity. (C′) is a spatially averaged (±SD) representation of (C). Kaede intensities in the notochord cells were subtracted as background. |
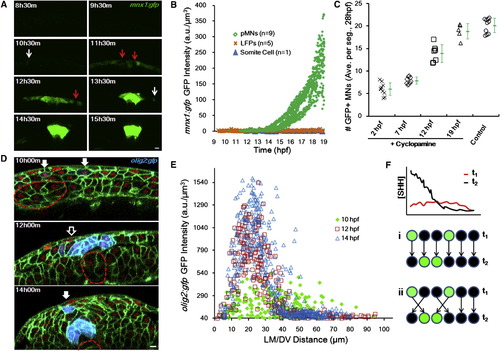
Progenitor Fates Are Specified during Cell Movements in Mixed Distributions (A) Time course of mnx1:gfp expression. Images are cross-sectional examples. Red arrows point to mixed negative cells. White arrows indicate scattered positive cells. Scale bar, 10 μm.(B) GFP (mnx1:gfp) levels in tracked cells through time. See alsoFigure S3 A. (C) Time course of Cyclopamine inhibition of pMN specification. Treatment of 100 μM Cyclopamine started at indicated times, and MNs were counted at 28 hpf as an indicator of pMN number. Numbers are averaged per embryo by number of neural segments counted. Green marks show average (±SD). See also Figure S3 B. (D) olig2:gfp (blue) domain formation. Green indicates cell membrane. Red shows cell nucleus. Filled arrows point to scattered positive cells. Empty arrows indicate mixed negative cells. Dashed lines represent notochord boundary. Scale bar, 10 μm. (E) Spatial distribution of olig2:gfp+ cells. At 10 hpf, they scatter in a wider range and are mixed with negative cells; in contrast, at 14 hpf, positive cells form a major stripe between 15 and 30 μm where negative cells are absent. (F) Two models for sharp stripe formation. (i) Late (improved) gradient rewrites responses, predicting late specification and stable positions. (ii) Cell sorting corrects wrong positions, predicting early specification and rearrangement afterward. |
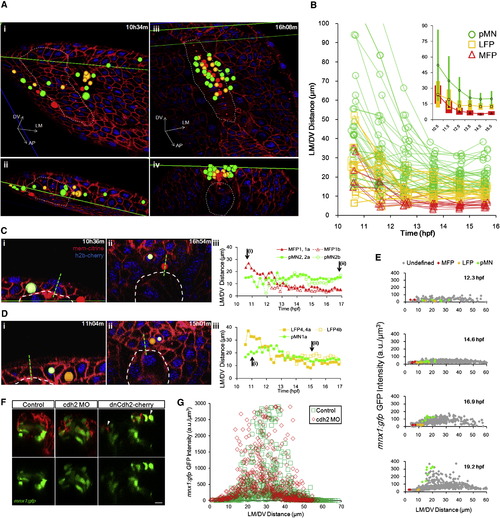
Progenitors Enter Stable Locations and Form Sharp Boundaries by Intensive Cell Rearrangement(A) Distribution of tracked cells from a fully analyzed ventral neural segment (comprised of 7 MFPs, 13 LFPs, and >20 pMNs) at early neural plate stage (i and ii) and neural tube stage (iii and iv). (ii) and (iv) are corresponding cross-sectional views of (i) and (iii). Green lines indicate the intersection of cross-section view and dorsal view (i, ii, and lower line in iii) or the upper boundary of the data set (iv and upper line in iii). Colored spheres are 3D locations of tracked cells (red: MFP; orange: LFP; green: pMN). Dashed lines represent notochord boundary. Small red spheres are notochord top midline. (B) Trajectories of tracked cells along the LM/DV axis demonstrating intensive sorting. For simplicity, only six time points on the tracks are plotted. A total of 66 tracks collected from four data sets are plotted. Some cells exhibit rearrangements beyond 16 hpf. Inset shows population average position ± SD (colored bars) of tracks by cell type plotted on the same axes. See also Figure S5A.(C) Example of relative positional changes of a pMN (light green indicates pMN2a) and a MFP (red shows MFP1,1a). Green dashed line represents midline. White dashed line designates notochord boundary. (iii) Full movement trajectories of the cells (same in D; for simplicity, one of the daughter cell tracks is continued with the mother track).(D) Example of positional switch between a pMN (light green indicates pMN1a) and a LFP cell (orange shows LFP4,4a). See also Movie S5.(E) mnx1:gfp expression boundary formation between LFPs and pMNs. GFP intensity distribution by position plotted for four time points. Each mark represents a cell (>200 cells per time point). Colored marks show tracked cells with known fates; gray marks indicate other segmented cells at the plotted time point. (F) Cdh2 perturbations on mnx1:gfp+ domain formation. Images are 24 hpf cross-sections of mosaic-labeled (cherry ± cdh2 morpholino [MO] and dominant-negative Cdh2-cherry fusion [dnCdh2-cherry]) neural tubes. Arrowheads point to puncta of dnCdh2-cherry. Scale bar, 10 μm. See also Figure S5E and Movie S7. (G) Quantification of GFP+ cell distribution in Cdh2 morphant and control. See also Figure S5E. |
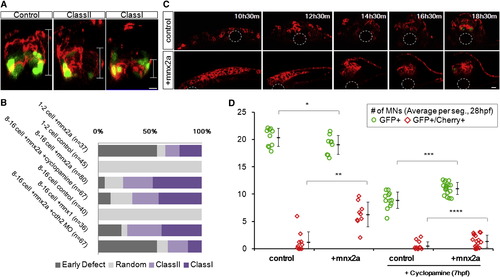
Ectopic Mnx2a-Expressing Cells Form a Sharp Ventral Domain Similar to the pMN Domain (A) The 24 hpf neural tube phenotypes after injection of mem-mCherry α mnx2a mRNAs in one blastomere at 8- to 16-cell stage are shown. Phenotypes are classified according to the distribution of mCherry+ cells (brackets): class I embryos contain cells only in the ventral third of the neural tube, class II embryos contain cells in the ventral two-thirds, and “random” contains injected cells throughout. Green indicates mnx1:gfp. Scale bars, 10 μm. See also Figure S6A.(B) Summary of mosaic injection experiments. Early defect embryos failed to form neurula. Cyclopamine treatment started at 7 hpf. (C) Sample time course of Mnx2a domain formation. This Mnx2a embryo became class II type. Dashed-line circles indicate position of the notochord. Green shows mnx1:gfp. Red designates mem-mCherry. Scale bar, 10 μm. See also Figure S6B. (D) Mnx2a-expressing cells replace “normal” pMNs. Imaging and counting of MNs as Figure 3C. p = 0.09, p = 0.00004, p = 0.0001, and p = 0.03 (Student’s t test). |
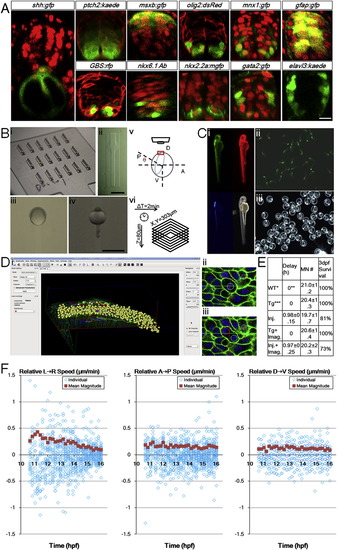
Zebrafish Ventral Neural Tube Pattern, In Toto Imaging Setup, Controls, and Analysis Tools, Related to Figure 1 (A) Gene expression patterns of 24hpf ventral neural tube. Red signals are ubiquitous membrane or nuclear markers to highlight cell locations and tissue morphology. Consistent with previous studies (Park et al., 2002 Schäfer et al., 2005; Kimura et al., 2008; Huang et al., 2012), a single column of triangular (apically constricted) medial floor plate (MFP, red color in Figure 1 Di) cells (shh:gfp+) sits in the ventral center bordering the dorsal top center of the notochord. 2 columns of lateral floor plate (LFP, yellow in Figure 1Di) cells (nkx2.2a:mgfp+, olig2:dsRed+(weak)) flank the MFP domain on both sides. In the LFP domain some cells become Kolmer-Agduhr (KA′′) neurons (gata2:gfp+). Dorsal to the floor plate cells sit the motor neuron progenitors (pMNs, light green in Figure 1 Di) and motor neurons (MNs, green in Figure 1Di) cells (olig2:dsRed+, mnx1:gfp+(strong)). Further dorsal to the 2-3 cell thick pMN domain sit the p2 and V2 interneuron (blue in Figure 1 Di) cells (gata2:gfp+, mnx1:gfp+(weak)). Weak mnx1:gfp expression extends beyond nkx6.1+ domain to 2/3 of the whole tube, and is bordered dorsally by msxb:gfp+ cells. At this stage, a ptch2:kaede gradient is seen across the DV axis, while GLI reporter GBS:rfp+ cells are mostly ventral. Differentiated neurons (elval3:kaede+) sit on the lateral sides away from the apical glia and progenitor cells (gfap:gfp+). Injections: membrane-citrine/cherry/RFP for ptch2, olig2, and GBS(GLI binding site) embryos; h2b-cherry for shh, msxb, mnx1, gfap, nkx2.2a, gata2 embryos. DAPI staining: nkx6.1 embryos. Scale bar: 10 μm.(B) Imaging setup used in the study. (i) Lucite dorsal mount template and (ii) cast agarose mount (for a full description, see Megason, 2009). (iii) Embryo mounted at 6hpf, dorsal side (shield) is facing up in the middle. (iv) Embryo mounted at 24hpf, dorsal side (neural tube) is facing up in the middle. (v) Mounting angle for high resolution time-lapse imaging of the neural plate. 7-9hpf embryos are used with the vegetal axis at an angel θ with the horizontal plane, θ depends on epiboly progress of the embryo. Note that with this setup uncertainties still remain that the embryos may rotate or tilt that cause the effective cell tracking time window to be cut short. In this report 26% of movies captured (13/50) provide optimal coverage and signal for thorough cell tracking and 80% (40/50) contain useful lineage and morphological information (for a full description, see Extended Experimental Procedures). (vi) Typically used time-lapse parameters. Scale bars: 1 mm. (C) Health control of recovered embryo from time-lapse imaging. (i) Day 2 embryo shows normal morphology. Data from embryos that showed abnormality at day 2 were not included in analysis. Red: h2b-cherry. Green: mem-citrine. Blue: mnx1:gfp. (ii, iii) Progeny of raised embryo from (i). Green signal: mnx1:gfp. Most recovered embryos were raised to 5 days and euthanized after confirming normal morphology and swimming behavior.(D) Data analysis by GoFigure 2. (i) User interface showing segmentation and tracking window of neural tube cells. (ii, iii) Example division tracked with spherical segmentation (for a full description, see Extended Experimental Procedures). (E) Experimental effects on developmental parameters. Injection of high concentration of labeling mRNAs can cause apparent delay for epiboly onset and progress, but does not alter the number of MNs at 28hpf or the neural tube progenitor domain pattern (data not shown). Imaging does not affect developmental parameters. WT refers to tg(mnx1:gfp) embryos that do not have actb2 transgenes and are uninjected, n = 9. Timing estimated by epiboly progress, setting WT group as 0. Tg refers to tg(actb2:mem-citrine/actb2:h2b-cherry) in addition to tg(mnx1:gfp), uninjected, n = 6. Injections are 2.3nl 30-40ng/μl each mem-citrine and h2b-cherry mRNA at single cell stage, into the cell or the yolk center, n = 16. Tg+imaging, n = 5. Injection+imaging, n = 11.(F) Cell movement speeds on different embryonic axes. Speeds are decomposed into vectors from Figure 1 F, negative values indicate moving in opposite direction as indicated by the arrow in the panel title. Population average values are calculated from the absolute magnitude values of individual speeds regardless of direction. These plots indicate lateral-medial movement is the main component of speed change in Figure 1 F. The DV speeds show more overlap of data points due to lower resolution in the axial dimension (closely aligned with DV axis of the embryo) of the raw data sets. |
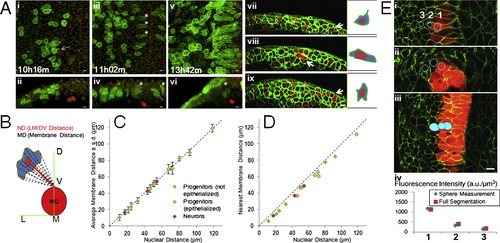
Morphological Changes of Moving Progenitors, Measuring Distances to Patterning Land Marks, and Marker Intensities, Related toFigure 2 (A) Mosaic membrane labeling analysis for cell morphology. (i to vi) Tg(actb2:h2b-tdTomato) embryo with one cell injected by mem-citrine mRNA at 16-cell stage. (i, iii, v) top views, (ii, iv, vi) corresponding cross-section views. White arrow in (i): projection of the cell. Asterisks: epithelialized cells. Filled red arrows: location of the notochord. Dashed lines: midline. (vii to ix) Embryos injected with mem-citrine and h2b-cherry mRNAs at one cell stage and further injected with mem-mCherry mRNA at 32 cell stage. White arrows: mem-mCherry+ cells. Cartoons on the right highlight morphology. At this resolution the projections of single cells rarely extend beyond cell diameters (i, vii, data not shown, n > 100). The cells become epithelialized as they enter the neural keel, the direction of stretching is roughly perpendicular to the LM/DV (Lateral-medial/Dorsal-ventral) axis (ii, iv, data not shown). All scale bars: 10 μm. See also Movie S3.(B) LM/DV distance compared to membrane distance. The top point of the notochord on the midline is used as the landmark for all positions in this study, defined as LM/DV distance. As both neural plate/tube and the notochord undergo dramatic morphological changes in the time windows studied, the LM/DV axis provides a suitable reference system. Note that LM/DV distance does not represent or imply Shh signal concentration (Further addressed in ). (C) Distance measurement by nucleus compared to integrated measurement from membrane points. Nuclear distance is measured as the distance from the nuclear segmentation center to the reference point (panel B). To measure the integrated membrane distance, 20 points were selected along the membrane following evenly changing angels and their distances to the reference are averaged and plotted ± s.d. (D) Similar plot as (C) plotting minimum membrane distance (closest point of the cell membrane to the reference). These plots show that nuclear distance to reference (LM/DV distance) is an accurate approximation of cell position regardless of cell type and morphology. (E) Intensity measurement of reporter expression in GoFigure 2. Spherical meshes are generated by manually clicking to place a seed inside a cell. The membrane signal provides confinement for verification in different views (top images) if the sphere is completely inside the cell. The sum of intensity of every voxel inside the sphere is divided by the volume of the sphere to generate the intensity reading used in this study. A more laborious method to measure intensity is to generate full segmentation (bottom image) using the membrane signal. The results from both methods differ by less than 5% (bottom plot, data not shown) and sphere measurement is sufficient to distinguish cells with slight differences (e.g., Cell#2 and #3). |
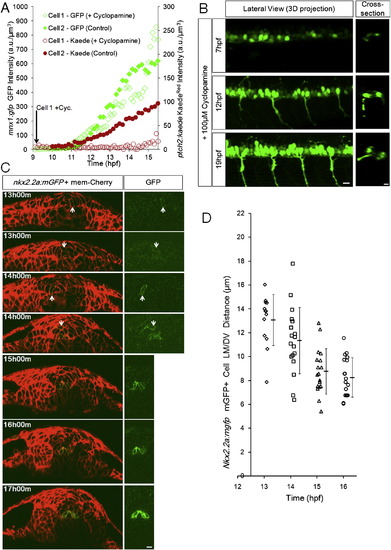
Timing of Specification and Domain Formation of pMNs and LFPs, Related to Figure 3 (A) Specified cells increase marker expression independently from Shh response. 2 representative tracks from a Cyclopamine treated embryo (Cell 1, Cyclopamine added at the start of imaging near 9hpf) and a control embryo (Cell 2, no Cyclopamine). Embryos are double transgenic for ptch2:Kaede and mnx1:gfp. A 405nm laser scan was performed before acquiring each time point to convert Kaede(green) to Kaede(red). 3 additional Cyclopamine tracks and 5 additional control tracks show similar behavior (data not shown).(B) Representative lateral 3D and cross-sectional views of Cyclopamine treated embryos. Early treatment does not fully remove GFP+ (mnx1:gfp) cells, a possible consequence of drug efficiency and/or early pMNs that can be specified in the absence of extracellular Shh (Lewis and Eisen, 2001; Chen et al., 2001). Cross-sections indicate that the specified cells still localize to correct positions. All scale bars: 10 μm. (C) Cross-sectional view of nkx2.2a:mgfp expression at different times. Before 13hpf potential mGFP+ cells could not be uncovered by imaging this transgenic line. At 13 and 14hpf GFP+ cells are found in variable locations and the left-right symmetric distribution of GFP+ cells in the LFP domain is not established. After 15hpf most GFP+ cells line up into the LFP domain on both sides of the triangular MFP cell, this position is indicative of LFP fate after 16hpf.(D) Nkx2.2a:mgfp+ cell distribution over time. Each mark represents the location of one mGFP+ cell at the corresponding time point. Note the narrowing of distribution from 14 to 16hpf and the population average (±s.d.) moving closer to the MFP/notochord. |
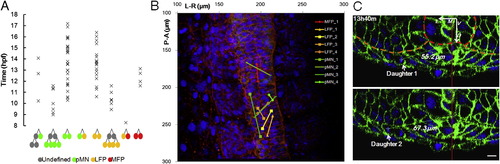
Positional Separation and Mixing of Sister Cells, Related to Figure 4 (A) Distribution of divisions in time by division types. 66 out of 83 divisions from Figure 4A are plotted (accurate times of some divisions were not recorded thus were not included). Divisions giving rise to pMNs and LFPs spread out along the same time window but a division giving rise to one pMN and one LFP was not found. (B) Separation of sister cells. Image is a 3D projection of the original data set at 16.9hpf, lines connect positions of sister cells. Due to different Z depth, the cells under the marks may not be the actual tracked cells, which might lie deeper below. A lot of sister cell pairs are separated by the midline, pMN_1 sister pair is separated into different neural segments. (C) Example of divisions that render one daughter closer to notochord than the other. Images are cross-section slices rendered and measured in GoFigure 2. Red line: midline. Scale bar: 10 μm. |
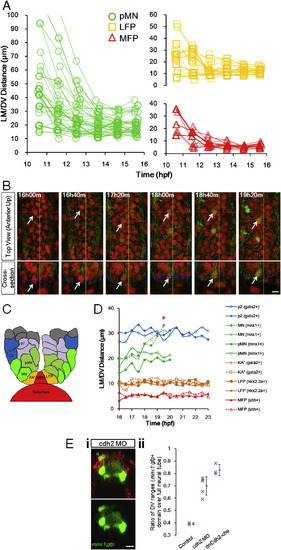
Domain Boundaries Remain Stable after 16 hpf, Cell-type Verifications by Additional Markers, and Additional cdh2 Perturbation Data, Related to Figure 5 (A) Plots by cell type from Figure 5B.(B) LFP cell type confirmation by later stage time-lapse of tg(gata2:gfp) embryos. KA” neurons (gata2:gfp+) are born from the LFP domain among LFP progenitors (nkx2.2a:mgfp+, Figures S1A and S3C; Huang et al., 2012). Note that the tracked LFP cell stays in stable location over time and becomes gata2:gfp+ by 18h40m. All scale bars: 10 μm.(C) Schematic illustration of cell positions in the final pattern. Enlarged and annotated from Figure 1Di.(D) Later stage tracking with various markers. Asterisk: Maturing MNs leave pMN domain and migrate laterally, effectively increasing the LM/DV distance. Neuron movements happen after progenitor domain formation and are distinct from progenitor movements. Cell positions are otherwise stable in this time window indicating stability of established pattern. See also Movie S6.(E) (i).Cdh2 perturbed embryo as in Figure 5F. Example of ectopically localized pMNs that are cherry+ (arrow). Both injected and uninjected (see also Figure 5F) pMNs might become misplaced, suggesting the pattern disruption caused by Cdh2 MO is cell nonautonomous. (ii). Cdh2 perturbed embryos have wider distribution of pMNs. The ratio between the maximum DV range of the mnx1:gfp+ cell cross-sectional distribution over the full length of the neural tube at 24hpf was measured. dnCdh2-che: dominant negative Cdh2-cherry fusion. Blue marks: measurement on one embryo. Red marks: average ratios (±s.d.). |
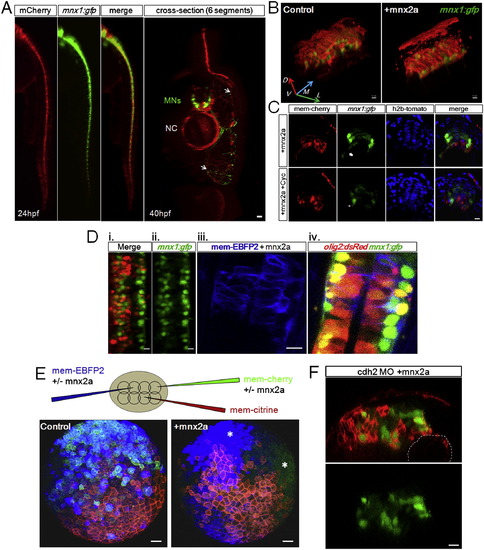
Ectopic Mnx2a-Expressing Cells Populate pMN Domain in a Shh-Independent Manner, Mnx2a-Injected Cells Exhibit Changed Adhesion Properties, Related to Figure 6(A) Mnx2a injected cells localize to pMN domains and become MNs. Left: Lateral view of a ClassI embryo, the Mnx2a+mCherry coinjected cells predominantly segregated to the ventral neural tube, overlapping with the transgenic expression domain of mnx1:gfp. Right: mCherry+ cells become MNs. Arrows: mCherry+ motor axons in the muscle tissue. All scale bars (except E) are 10 μm.(B) Mnx2a cells populate extensively and exclusively the ventral neural tube. Images are 3D projections of original 2-channel z-stacks of 24hpf embryos. Unlike control embryos whose injected cells are randomly scattered in the neural tube (left), mnx2a injected cells form a clear ventral domain (right). The mCherry+ patch of cells seen above the neural tube are skin cells.(C) Cyclopamine treatment does not alter the Mnx2a phenotypes. 100 μM Cyclopamine was applied to dechorionated tg(mnx1:gfp/actb2:h2b-tdTomato) embryos at 7hpf. The axonal projections of the MNs were affected (Arrow, asterisk; Charron et al., 2003) but the pMN domain “stripe” formed by Cherry+ cells was not affected.(D) Mnx2a injected cells become pMNs. (i, ii). Top view of example tg(mnx1:gfp) embryo injected with Mnx2a and H2B-mCherry mRNA and treated with Cyclopamine at 12hpf, whose left half is populated by mCherry+ cells and have increased number of GFP+ cells compared to the right half. (iii, iv). Top view of example tg(mnx1:gfp/olig2:dsRed) embryo injected with Mnx2a and mem-EBFP2 mRNA. EBFP2+ cells are dsRed+ and show progenitor location and morphology. (E) Mnx2a injected cells form clusters at early neural plate stage. 3D projections (animal/dorsal view) of typical 8hpf triple injected embryos. Injections are performed as shown in the illustration. The formation of large clusters by Mnx2a cells as compared to random mixing of control cells suggests changes of adhesion properties in these cells, which may play a role in cell sorting. The injection amount of Mnx2a mRNA is higher (20ng/μl) in these experiments compared to Figure 6. Scale bar: 50 μm.(F) Mnx2a and cdh2 MO coinjected cells still form clusters and localize ventrally despite strong morphogenesis defects. Injections are performed as in Figure 6A. Many embryos show severe early defects and the survivors often show distorted neural tubes (image is a typical example). Mnx2a induced adhesion still appears to be in effect in these embryos. Dashed lines: Notochord boundary. |
Reprinted from Cell, 153(3), Xiong, F., Tentner, A.R., Huang, P., Gelas, A., Mosaliganti, K.R., Souhait, L., Rannou, N., Swinburne, I.A., Obholzer, N.D., Cowgill, P.D., Schier, A.F., and Megason, S.G., Specified neural progenitors sort to form sharp domains after noisy shh signaling, 550-561, Copyright (2013) with permission from Elsevier. Full text @ Cell