
Fig. 2
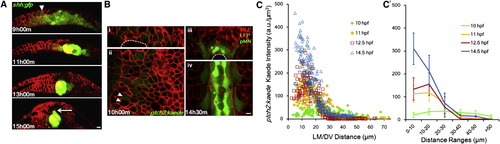
Shape Changes of Shh Gradient and Heterogeneity in Spatial Distribution of Responses (A) Time course of notochord formation by shh:gfp+ cells in cross-section. Red shows mem-mCherry (same below). Arrowhead points to GFP+ cells in neural ectoderm/plate. Arrow indicates MFP cell expressing GFP. Scale bar, 10 μm.(B) Cross-section (i and iii) and longitudinal section (ii and iv) of ptch2:kaede expression pattern. Arrowheads point to neighbor cells with different Kaede levels. Asterisks indicate stereotypic cell fates at the indicated locations. Scale bar, 10 μm. See also Figure S1A.<(C and C′) Kaede level spatial distribution through time. Each mark represents a segmented cell with measured position and fluorescence intensity. (C′) is a spatially averaged (±SD) representation of (C). Kaede intensities in the notochord cells were subtracted as background. |
Reprinted from Cell, 153(3), Xiong, F., Tentner, A.R., Huang, P., Gelas, A., Mosaliganti, K.R., Souhait, L., Rannou, N., Swinburne, I.A., Obholzer, N.D., Cowgill, P.D., Schier, A.F., and Megason, S.G., Specified neural progenitors sort to form sharp domains after noisy shh signaling, 550-561, Copyright (2013) with permission from Elsevier. Full text @ Cell