
Fig. S2
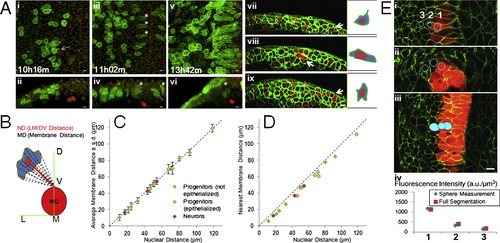
Morphological Changes of Moving Progenitors, Measuring Distances to Patterning Land Marks, and Marker Intensities, Related toFigure 2 (A) Mosaic membrane labeling analysis for cell morphology. (i to vi) Tg(actb2:h2b-tdTomato) embryo with one cell injected by mem-citrine mRNA at 16-cell stage. (i, iii, v) top views, (ii, iv, vi) corresponding cross-section views. White arrow in (i): projection of the cell. Asterisks: epithelialized cells. Filled red arrows: location of the notochord. Dashed lines: midline. (vii to ix) Embryos injected with mem-citrine and h2b-cherry mRNAs at one cell stage and further injected with mem-mCherry mRNA at 32 cell stage. White arrows: mem-mCherry+ cells. Cartoons on the right highlight morphology. At this resolution the projections of single cells rarely extend beyond cell diameters (i, vii, data not shown, n > 100). The cells become epithelialized as they enter the neural keel, the direction of stretching is roughly perpendicular to the LM/DV (Lateral-medial/Dorsal-ventral) axis (ii, iv, data not shown). All scale bars: 10 μm. See also Movie S3.(B) LM/DV distance compared to membrane distance. The top point of the notochord on the midline is used as the landmark for all positions in this study, defined as LM/DV distance. As both neural plate/tube and the notochord undergo dramatic morphological changes in the time windows studied, the LM/DV axis provides a suitable reference system. Note that LM/DV distance does not represent or imply Shh signal concentration (Further addressed in ). (C) Distance measurement by nucleus compared to integrated measurement from membrane points. Nuclear distance is measured as the distance from the nuclear segmentation center to the reference point (panel B). To measure the integrated membrane distance, 20 points were selected along the membrane following evenly changing angels and their distances to the reference are averaged and plotted ± s.d. (D) Similar plot as (C) plotting minimum membrane distance (closest point of the cell membrane to the reference). These plots show that nuclear distance to reference (LM/DV distance) is an accurate approximation of cell position regardless of cell type and morphology. (E) Intensity measurement of reporter expression in GoFigure 2. Spherical meshes are generated by manually clicking to place a seed inside a cell. The membrane signal provides confinement for verification in different views (top images) if the sphere is completely inside the cell. The sum of intensity of every voxel inside the sphere is divided by the volume of the sphere to generate the intensity reading used in this study. A more laborious method to measure intensity is to generate full segmentation (bottom image) using the membrane signal. The results from both methods differ by less than 5% (bottom plot, data not shown) and sphere measurement is sufficient to distinguish cells with slight differences (e.g., Cell#2 and #3). |
Reprinted from Cell, 153(3), Xiong, F., Tentner, A.R., Huang, P., Gelas, A., Mosaliganti, K.R., Souhait, L., Rannou, N., Swinburne, I.A., Obholzer, N.D., Cowgill, P.D., Schier, A.F., and Megason, S.G., Specified neural progenitors sort to form sharp domains after noisy shh signaling, 550-561, Copyright (2013) with permission from Elsevier. Full text @ Cell