
Fig. 1
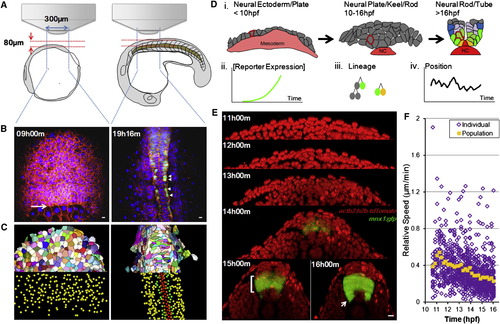
In Toto Imaging Captures Dynamics of Neural Progenitors during Neural Tube Formation in Zebrafish Embryos (A) Schematic illustration of imaging setup. See also the Extended Experimental Procedures. (B) Sample time points of raw data rendered in 3D projection dorsal view. Red indicates mem-citrine, blue designates h2b-cherry, and green shows mnx1:gfp. Arrow points to the frontier of epiboly movement. Arrowheads indicate differentiating MNs. All time annotations are hours (and minutes) postfertilization (hpf). Scale bars, 10 μm. See also Movie S1. (C) Processed data by GoFigure 2 and ACME (Mosaliganti et al., 2012) software from images in (B). Top halves: membrane segmentations (random colors to distinguish neighbors); bottom halves: nuclei segmentations for cell tracking (red indicates MFPs, orange indicates LFPs, green shows pMNs, and yellow indicates unidentified cells). (D) Schematic illustration of cell-tracking analysis. Drawings are based on cross-section images; colors are assigned based on marker expression (red: Shh; yellow: nkx2.2a; green: mnx1; blue: gata2). Part of the notochord (NC, Shh+) is included. (i) Morphogenesis during the patterning process; single cells can be tracked throughout (e.g., highlighted cell with red membrane). Tracks carry information of reporter expression (ii), lineage relationships (iii), and movement trajectories (iv). See also Figure S1 A.(E) Cross-sectional view (dorsal side up) of sample data set. Red indicates nuclei. A GFP+ stripe domain emerges (bracket, bottom-left image). Arrow points to differentiating MNs exiting the GFP domain. Scale bar, 10 μm. See also Movie S2.(F) Relative speed of cell movement during neural tube formation. Each purple mark represents the speed of a single cell; 41 tracked ventral cells are plotted. Relative speed is calculated by dividing a cell’s positional change (μm) between two time points over the time difference (11.5 min). Position is measured relative to the average position of all tracked cells to eliminate global movements introduced by embryo rotation/shifting. Orange marks show average speed. See also Figure S1F. |
Reprinted from Cell, 153(3), Xiong, F., Tentner, A.R., Huang, P., Gelas, A., Mosaliganti, K.R., Souhait, L., Rannou, N., Swinburne, I.A., Obholzer, N.D., Cowgill, P.D., Schier, A.F., and Megason, S.G., Specified neural progenitors sort to form sharp domains after noisy shh signaling, 550-561, Copyright (2013) with permission from Elsevier. Full text @ Cell