
Fig. S1
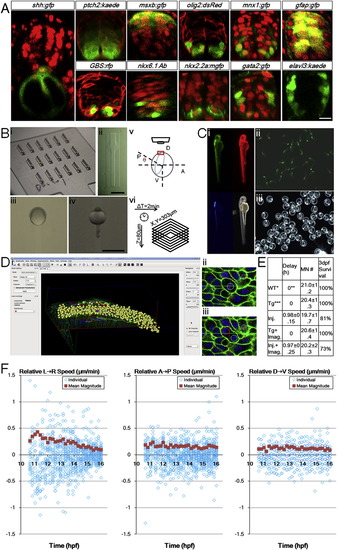
Zebrafish Ventral Neural Tube Pattern, In Toto Imaging Setup, Controls, and Analysis Tools, Related to Figure 1 (A) Gene expression patterns of 24hpf ventral neural tube. Red signals are ubiquitous membrane or nuclear markers to highlight cell locations and tissue morphology. Consistent with previous studies (Park et al., 2002 Schäfer et al., 2005; Kimura et al., 2008; Huang et al., 2012), a single column of triangular (apically constricted) medial floor plate (MFP, red color in Figure 1 Di) cells (shh:gfp+) sits in the ventral center bordering the dorsal top center of the notochord. 2 columns of lateral floor plate (LFP, yellow in Figure 1Di) cells (nkx2.2a:mgfp+, olig2:dsRed+(weak)) flank the MFP domain on both sides. In the LFP domain some cells become Kolmer-Agduhr (KA′′) neurons (gata2:gfp+). Dorsal to the floor plate cells sit the motor neuron progenitors (pMNs, light green in Figure 1 Di) and motor neurons (MNs, green in Figure 1Di) cells (olig2:dsRed+, mnx1:gfp+(strong)). Further dorsal to the 2-3 cell thick pMN domain sit the p2 and V2 interneuron (blue in Figure 1 Di) cells (gata2:gfp+, mnx1:gfp+(weak)). Weak mnx1:gfp expression extends beyond nkx6.1+ domain to 2/3 of the whole tube, and is bordered dorsally by msxb:gfp+ cells. At this stage, a ptch2:kaede gradient is seen across the DV axis, while GLI reporter GBS:rfp+ cells are mostly ventral. Differentiated neurons (elval3:kaede+) sit on the lateral sides away from the apical glia and progenitor cells (gfap:gfp+). Injections: membrane-citrine/cherry/RFP for ptch2, olig2, and GBS(GLI binding site) embryos; h2b-cherry for shh, msxb, mnx1, gfap, nkx2.2a, gata2 embryos. DAPI staining: nkx6.1 embryos. Scale bar: 10 μm.(B) Imaging setup used in the study. (i) Lucite dorsal mount template and (ii) cast agarose mount (for a full description, see Megason, 2009). (iii) Embryo mounted at 6hpf, dorsal side (shield) is facing up in the middle. (iv) Embryo mounted at 24hpf, dorsal side (neural tube) is facing up in the middle. (v) Mounting angle for high resolution time-lapse imaging of the neural plate. 7-9hpf embryos are used with the vegetal axis at an angel θ with the horizontal plane, θ depends on epiboly progress of the embryo. Note that with this setup uncertainties still remain that the embryos may rotate or tilt that cause the effective cell tracking time window to be cut short. In this report 26% of movies captured (13/50) provide optimal coverage and signal for thorough cell tracking and 80% (40/50) contain useful lineage and morphological information (for a full description, see Extended Experimental Procedures). (vi) Typically used time-lapse parameters. Scale bars: 1 mm. (C) Health control of recovered embryo from time-lapse imaging. (i) Day 2 embryo shows normal morphology. Data from embryos that showed abnormality at day 2 were not included in analysis. Red: h2b-cherry. Green: mem-citrine. Blue: mnx1:gfp. (ii, iii) Progeny of raised embryo from (i). Green signal: mnx1:gfp. Most recovered embryos were raised to 5 days and euthanized after confirming normal morphology and swimming behavior.(D) Data analysis by GoFigure 2. (i) User interface showing segmentation and tracking window of neural tube cells. (ii, iii) Example division tracked with spherical segmentation (for a full description, see Extended Experimental Procedures). (E) Experimental effects on developmental parameters. Injection of high concentration of labeling mRNAs can cause apparent delay for epiboly onset and progress, but does not alter the number of MNs at 28hpf or the neural tube progenitor domain pattern (data not shown). Imaging does not affect developmental parameters. WT refers to tg(mnx1:gfp) embryos that do not have actb2 transgenes and are uninjected, n = 9. Timing estimated by epiboly progress, setting WT group as 0. Tg refers to tg(actb2:mem-citrine/actb2:h2b-cherry) in addition to tg(mnx1:gfp), uninjected, n = 6. Injections are 2.3nl 30-40ng/μl each mem-citrine and h2b-cherry mRNA at single cell stage, into the cell or the yolk center, n = 16. Tg+imaging, n = 5. Injection+imaging, n = 11.(F) Cell movement speeds on different embryonic axes. Speeds are decomposed into vectors from Figure 1 F, negative values indicate moving in opposite direction as indicated by the arrow in the panel title. Population average values are calculated from the absolute magnitude values of individual speeds regardless of direction. These plots indicate lateral-medial movement is the main component of speed change in Figure 1 F. The DV speeds show more overlap of data points due to lower resolution in the axial dimension (closely aligned with DV axis of the embryo) of the raw data sets. |
Reprinted from Cell, 153(3), Xiong, F., Tentner, A.R., Huang, P., Gelas, A., Mosaliganti, K.R., Souhait, L., Rannou, N., Swinburne, I.A., Obholzer, N.D., Cowgill, P.D., Schier, A.F., and Megason, S.G., Specified neural progenitors sort to form sharp domains after noisy shh signaling, 550-561, Copyright (2013) with permission from Elsevier. Full text @ Cell