
|
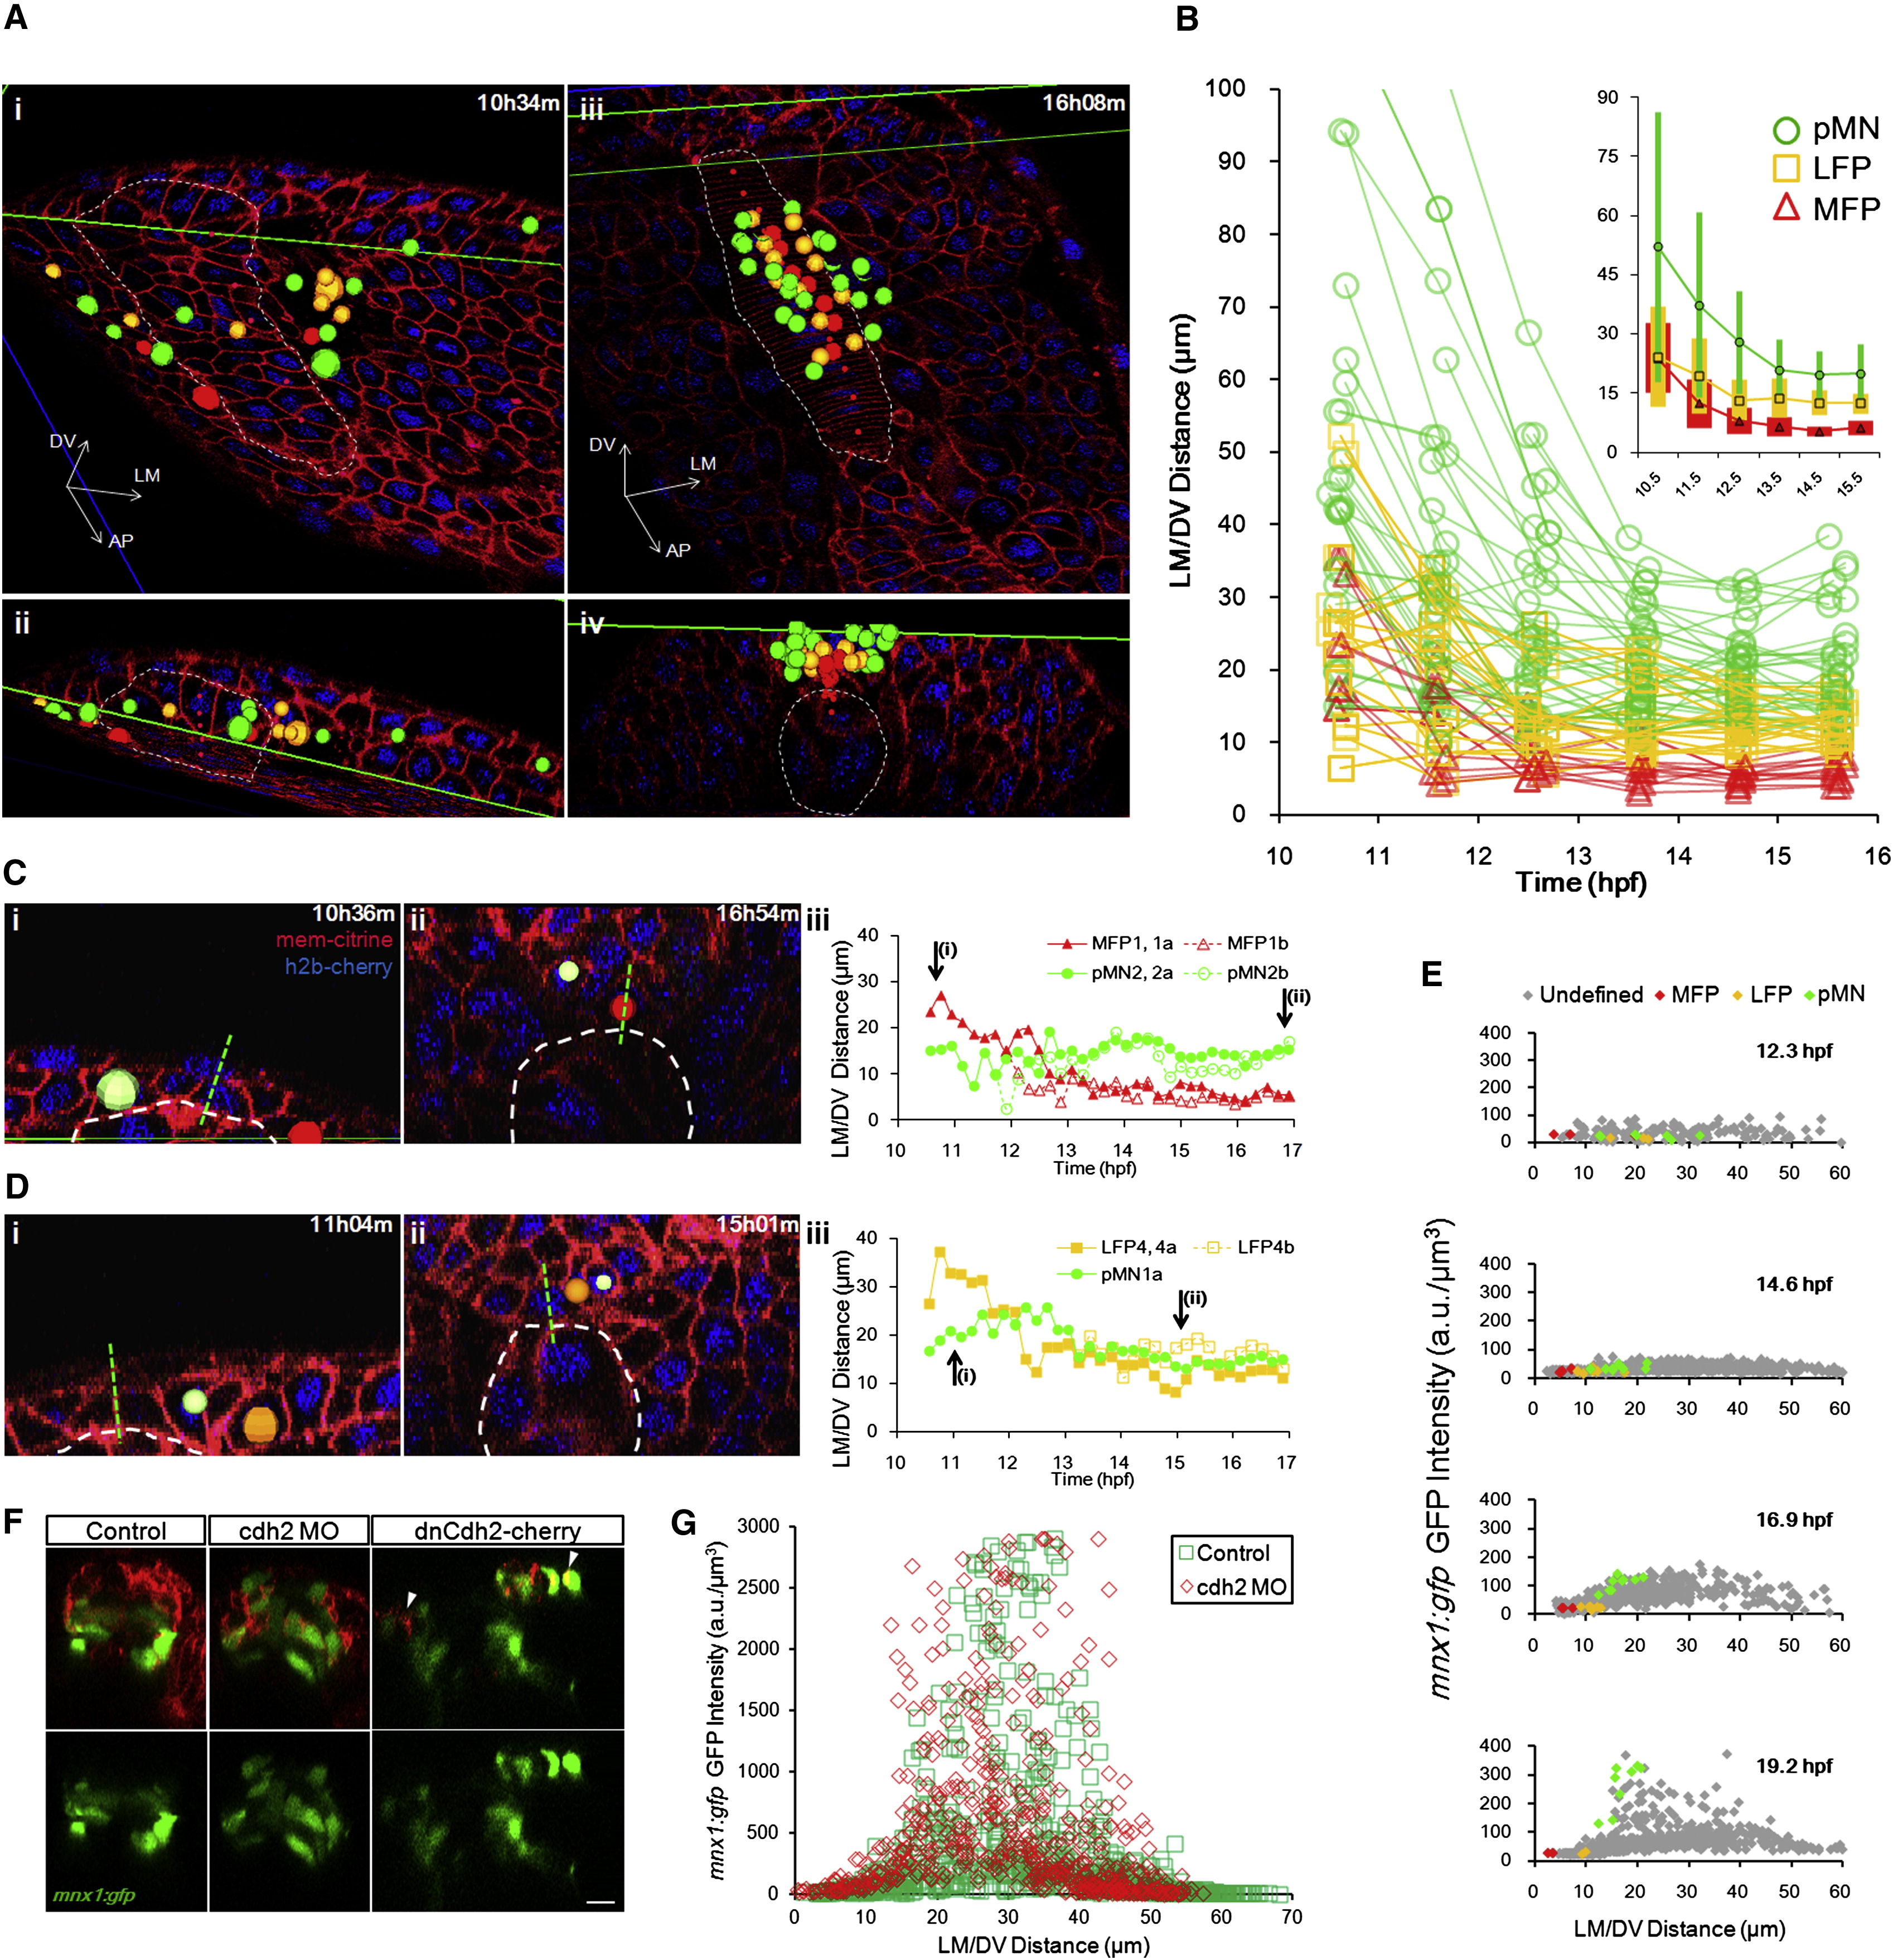
Fig. 5 Progenitors Enter Stable Locations and Form Sharp Boundaries by Intensive Cell Rearrangement(A) Distribution of tracked cells from a fully analyzed ventral neural segment (comprised of 7 MFPs, 13 LFPs, and >20 pMNs) at early neural plate stage (i and ii) and neural tube stage (iii and iv). (ii) and (iv) are corresponding cross-sectional views of (i) and (iii). Green lines indicate the intersection of cross-section view and dorsal view (i, ii, and lower line in iii) or the upper boundary of the data set (iv and upper line in iii). Colored spheres are 3D locations of tracked cells (red: MFP; orange: LFP; green: pMN). Dashed lines represent notochord boundary. Small red spheres are notochord top midline. (B) Trajectories of tracked cells along the LM/DV axis demonstrating intensive sorting. For simplicity, only six time points on the tracks are plotted. A total of 66 tracks collected from four data sets are plotted. Some cells exhibit rearrangements beyond 16 hpf. Inset shows population average position ± SD (colored bars) of tracks by cell type plotted on the same axes. See also Figure S5A.(C) Example of relative positional changes of a pMN (light green indicates pMN2a) and a MFP (red shows MFP1,1a). Green dashed line represents midline. White dashed line designates notochord boundary. (iii) Full movement trajectories of the cells (same in D; for simplicity, one of the daughter cell tracks is continued with the mother track).(D) Example of positional switch between a pMN (light green indicates pMN1a) and a LFP cell (orange shows LFP4,4a). See also Movie S5.(E) mnx1:gfp expression boundary formation between LFPs and pMNs. GFP intensity distribution by position plotted for four time points. Each mark represents a cell (>200 cells per time point). Colored marks show tracked cells with known fates; gray marks indicate other segmented cells at the plotted time point. (F) Cdh2 perturbations on mnx1:gfp+ domain formation. Images are 24 hpf cross-sections of mosaic-labeled (cherry ± cdh2 morpholino [MO] and dominant-negative Cdh2-cherry fusion [dnCdh2-cherry]) neural tubes. Arrowheads point to puncta of dnCdh2-cherry. Scale bar, 10 μm. See also Figure S5E and Movie S7. (G) Quantification of GFP+ cell distribution in Cdh2 morphant and control. See also Figure S5E.
Reprinted from Cell, 153(3), Xiong, F., Tentner, A.R., Huang, P., Gelas, A., Mosaliganti, K.R., Souhait, L., Rannou, N., Swinburne, I.A., Obholzer, N.D., Cowgill, P.D., Schier, A.F., and Megason, S.G., Specified neural progenitors sort to form sharp domains after noisy shh signaling, 550-561, Copyright (2013) with permission from Elsevier. Full text @ Cell