
- Title
-
Repression of Hedgehog signalling is required for the acquisition of dorsolateral cell fates in the zebrafish otic vesicle
- Authors
- Hammond, K.L., van Eeden, F.J., and Whitfield, T.T.
- Source
- Full text @ Development
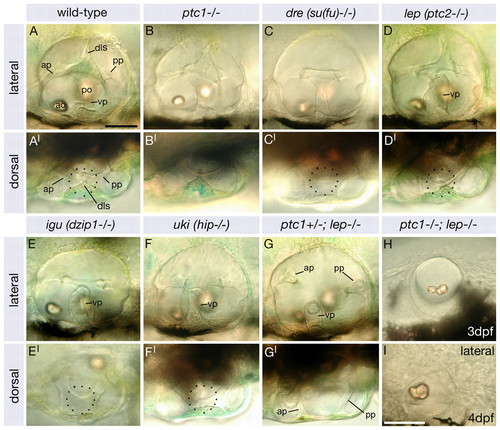
Dorsolateral otic structures are lost with increasing severity of otic phenotype in a panel of Hh pathway inhibitor mutants. Images of live zebrafish inner ears taken using DIC optics at 4 dpf, except in H (3 dpf). (A-I) Lateral views; anterior to left, dorsal to top. (A′-G′) Dorsal views; anterior to left, lateral to bottom. (A,A′) Wild-type inner ear showing the three pillars around which the semicircular canals form, the dorsolateral septum and the two otoliths. (B,B′) ptc1-/- ears are normal. (C,C′) The dls is absent in dre. (D,D′) In lep the dls and ventral canal pillar (vp) are abnormal. (E-F′) In igu and uki the dls is absent and the ventral canal projection is abnormal. (G,G′) In ptc1-/-; lep+/- all three canal projections are reduced and the dls is absent. (H,I) In ptc1-/-; lep-/- embryos the ear is small, the otoliths fuse and no canal projections or dls form. Dotted circle denotes dls (A′,D′) or region where it should form (C′,E′,F′). Scale bars: 50 μm (bar in A applies to A-H). ap, anterior semicircular canal pillar; ao, anterior otolith; dls, dorsolateral septum; po, posterior otolith; pp, posterior semicircular canal pillar; vp, ventral semicircular canal pillar. |
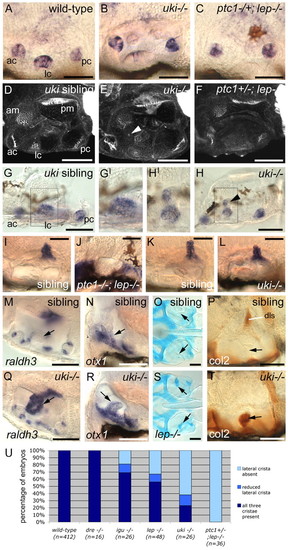
Dorsolateral patterning defects appear as the severity of otic phenotype increases in the Hh inhibitor mutants. (A-H′) Cristae are lost in the more severe Hh inhibitor mutants. (A-C,G-H) msxc in situ hybridisation at 3 dpf. (D-F) Confocal z-stacks of ears stained with FITC-phalloidin to reveal actin in the sensory hair bundles at 3 dpf. (A,D,G,G′) Three cristae (ac, lc, pc) are present in wild-type ears. (B,E,H,H′) uki mutants with reduced lateral cristae; the medial region of the lateral crista is sometimes displaced towards the anterior macula (arrowheads, E,H). (C,F) ptc1-/-; lep-/- mutants with no lateral cristae. (I-L) The endolymphatic duct is reduced in uki embryos and absent in ptc1-/-; lep-/- double mutants: in situ hybridisation to foxi1 at 68 hpf (I,J) and 72 hpf (K,L). (M-T) The ventral semicircular canal pillar (arrows) is abnormal in lep and uki homozygotes, with ectopic expression of raldh3 (M,Q) and Collagen type II protein (P,T) at 3 dpf, and ectopic Alcian Blue staining at 5 dpf (O,S). Expression of otx1 at 3 dpf in the ventral pillar is unaffected (N,R). igu embryos show similar defects in the ventral pillar (not shown). (A-C,I-L,P,T) Lateral views; anterior to left, dorsal to top. (D-H,M,Q) Dorsal views; anterior to left, medial to top. (O,S) Dorsal views; anterior to left. (N,R) Transverse hand-cut sections, ∼50 μm. Boxes in G,H show the region enlarged in G′,H′. Scale bars: 50 μm. (U) Chart showing the proportion of Hh inhibitor mutant embryos with lost or reduced lateral cristae. ac, anterior crista; am, anterior macula; dls, dorsolateral septum; lc, lateral crista; pc, posterior crista; pm, posterior macula. |
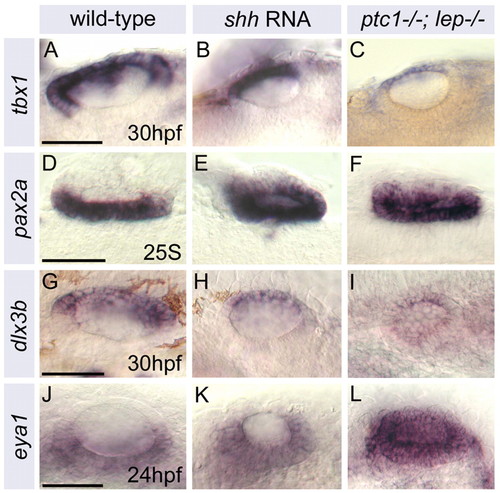
Ventromedial otic territories are expanded at the expense of dorsolateral domains in shh RNA-injected and ptc1-/-; lep-/- embryos. (A-L) Expression of lateral (tbx1), medial (pax2a), dorsal (dlx3b) and ventral (eya1) markers in the zebrafish otic vesicle. Expression domains of dorsolateral markers (tbx1, dlx3b) are reduced relative to ear size in ptc1-/-; lep-/- and shh-injected embryos, whereas ventromedial markers (pax2a, eya1) are expanded. Staining in siblings was indistinguishable from wild type. (A-F) Dorsal views; anterior to left, lateral to top. (G-L) Lateral views; anterior to left, dorsal to top. Scale bars: 50 μm (as shown in left-hand image of each trio). |
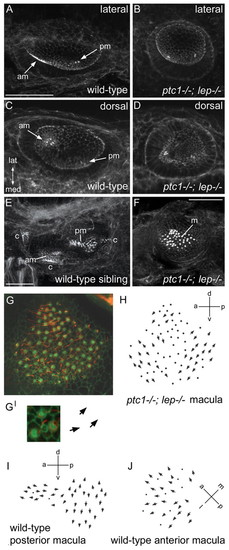
Otic vesicles of ptc1-/-; lep-/- embryos contain a single medial macula with double posterior polarity, which originates as two separate domains of hair cells. (A-F) Merged confocal z-stacks of otic vesicles at 33 hpf (A-D) and 3 dpf (E,F) stained with FITC-phalloidin. Hair cell bundles appear as bright dots. Two separate sensory patches are seen in ptc1-/-; lep-/- ears (B,D), as in wild-type ears, but both arise in a medial position like the posterior patch in wild-type ears (compare C with D). By 3 dpf, the patches have merged to form a single macula in ptc1-/-; lep-/- (F). (G) Merged confocal z-stack of a 70 hpf ptc1-/-; lep-/- macula stained with FITC-phalloidin (cuticular plate/stereocilia; green) and anti-acetylated tubulin antibody (kinocilia; red). (G′) Enlarged image of three hair cells, showing the planar polarity of each hair cell (arrows). (H) Polarity map of the ptc1-/-; lep-/- medial macula shown in G. Additional examples are shown in Fig. S3 in the supplementary material. Hair bundles point away from a midline in both the anterior and posterior halves of the macula, resembling the pattern seen in wild-type posterior maculae. (I,J) Polarity maps of wild-type posterior and anterior maculae for comparison. (A,B,E,F) Lateral views; anterior to left, dorsal to top. (C,D) Dorsal views; anterior to left, lateral to top. am, anterior macula; c, crista; lat, lateral; m, medial macula; med, medial; pm, posterior macula. Scale bars: 50 μm (bar in A applies to A-D). |
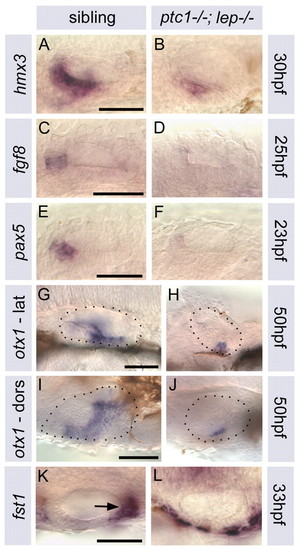
Expression of AP markers is altered in ptc1-/-; lep-/- otic vesicles. (A-L) Expression of anterior (hmx3, fgf8, pax5), ventral/central (otx1) and posterior (fst1) otic markers. In ptc1-/-; lep-/-, expression of anterior markers is reduced or absent, otx1 expression is reduced, and posterior fst1 expression (arrow, K) is lost in the ear but upregulated in surrounding tissues. (A-H) Lateral views, anterior to left, dorsal to top. (I-L) Dorsal views; anterior to left, lateral to bottom. Scale bars: 50 μm (in left-hand image of each pair). |
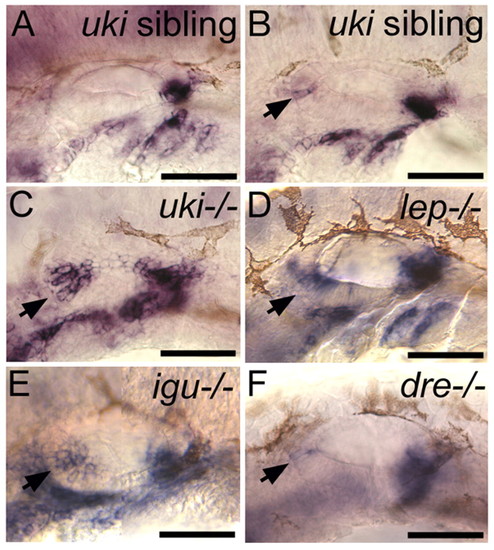
Expression of the posterior marker fst1 is duplicated at the anterior of the otic vesicle in the Hh inhibitor mutants. (A) Posterior otic expression of fst1 in an uki sibling embryo at 30 hpf, indistinguishable from the wild-type pattern. (B-F) In uki-/-, lep-/-, igu-/- and, to a lesser extent, dre-/- and presumed heterozygous uki sibling embryos, fst1 is ectopically expressed at the anterior of the otic vesicle at 30 hpf (arrows). Lateral views; anterior to left, dorsal to top. E is a composite of two images. Scale bars: 50 μm. |
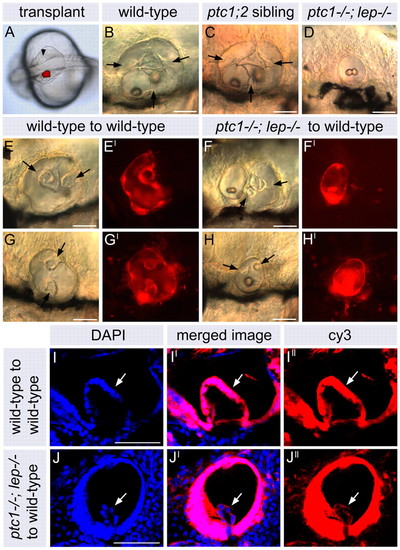
Transplanted ptc1-/-; lep-/- otic tissue does not contribute to semicircular canal projections. (A) Dorsal view of a live 20S embryo immediately post-transplant. Rhodamine-dextran-labelled donor otic tissue was visualized fluorescently and is shown as a red overlay. Transplanted tissue was placed directly opposite the unlabelled host ear (arrowhead). (B-D) DIC images of live, untransplanted ears at 3 dpf. Arrows indicate semicircular canal pillars. Embryos in C and D were injected with rhodamine-dextran at the one- to two-cell stage. (E-H′) DIC images of live, transplanted otic vesicles at 3 dpf (E-H) and fluorescent images revealing the rhodamine-dextran-labelled donor tissue (E′-H′). Arrows in E and G indicate development of semicircular canal projection and pillar tissue in transplanted wild-type ears. (F,F′) Example of a ptc1-/-; lep-/- transplant in which both ptc1-/-; lep-/- and wild-type otic tissue are present: the ptc1-/-; lep-/- tissue has formed a small, separate otic vesicle containing no semicircular canal projection tissue. Arrows in F indicate semicircular canal projection and pillar tissue derived from the unlabelled host. (H,H′) Example of a transplanted ptc1-/-; lep-/- ear in which a single otic vesicle is present and which contains semicircular canal projection tissue (arrows). This is derived from host tissue (see J-J′). (I-J′) Confocal sections through semicircular canal projection tissue in a wild-type transplant (I-I′) and a ptc1-/-; lep-/- transplant (J-J′). (I,J) DAPI stain revealing the nuclei of each cell; (I′,J′) Cy3-tyramide-labelled biotin-dextran marking transplanted tissue. (I-I′) Semicircular canal projection tissue in transplanted wild-type otic vesicles (arrow) is labeled with Cy3 and derived from transplanted donor tissue. (J-J′) Semicircular canal projection tissue in transplanted ptc1-/-; lep-/- otic vesicles is unlabelled and derived from the host. All lateral views; anterior to left, dorsal to top. Scale bars: 50 μm in A-H; 25 μm in I-J′. |
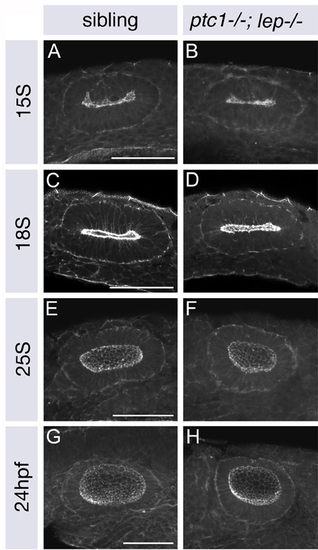
ptc1-/-; lep-/- otic vesicles are the same size as those of siblings at 15S, but smaller and rounder by 25S. (A-H) Merged confocal z-stacks of wild-type and ptc1-/-; lep-/- otic vesicles stained with FITC-phalloidin to mark cortical actin and reveal the morphology of the otic vesicle. Anterior to left, dorsal to top. Scale bars: 50 μm. |
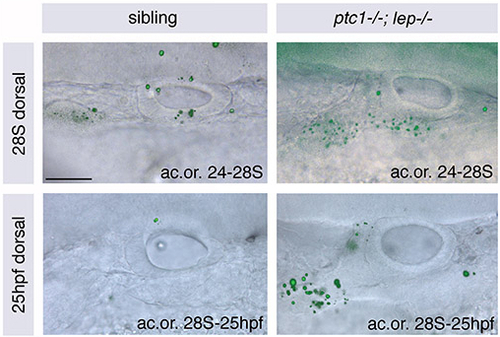
There is no increase in cell death in DL regions of ptc1-/-; lep-/- otic vesicles compared with those of siblings. Otic vesicles of wild-type and ptc1-/-; lep-/- embryos stained with Acridine Orange (ac.or.) between 24 and 28S (top) and 28S and 25 hpf (bottom) to reveal regions of cell death. Fluorescent images showing Acridine Orange stain are overlaid onto DIC images of live ears. There is no increase in cell death in the ptc1-/-; lep-/- otic vesicle itself. However, there is a significant increase anteroventral and lateral to the otic vesicle, which is likely to include the forming statoacoustic ganglion. Dorsal views; anterior to left, medial to top. Scale bar: 50 μm. |
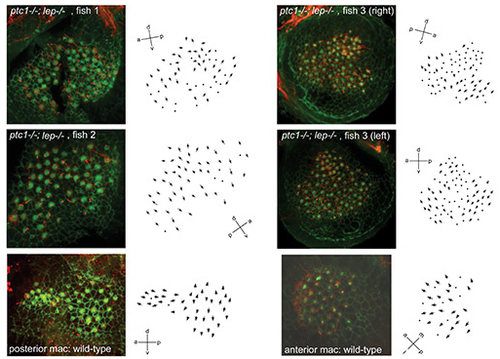
The single medial macula of ptc1-/-; lep-/- embryos has double posterior character. Merged confocal z-stacks of maculae of 3 dpf ptc1-/-; lep-/- and wild-type embryos stained with FITC-phalloidin (green) to reveal the actin in the stereociliary bundles of the hair cells and with anti-acetylated tubulin antibody (red) to reveal the kinocilia. Arrows show polarity maps for each macula. Hair bundles point away from a midline in both the anterior and posterior halves of the ptc1-/-; lep-/- maculae, resembling the pattern seen in wild-type posterior maculae. a, anterior; d, dorsal; m, medial; mac, macula; l, lateral; p, posterior; v, ventral. |
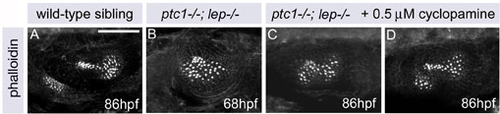
Low doses of cyclopamine can partially rescue the phenotype of the triangular ptc1-/-; lep-/- medial macula to a bow tie shape. (A-D) Merged confocal z-stacks of maculae stained with FITC-phalloidin to reveal the actin-rich stereocilia of the sensory hair cells. Application of 0.5 μM cyclopamine to ptc1-/-; lep-/- embryos rescues the triangular macula phenotype (B) to a bow-tie shape (C) resembling that seen in shh-RNA injected embryos. Lateral views; anterior to left, dorsal to top. Scale bar: 50 μm. |
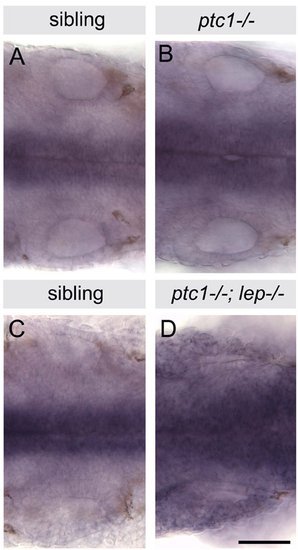
ptc2 expression is raised in ptc1-/- and ptc1-/-; lep-/- homozygotes. In situ hybridisation for ptc2. Dorsal views of whole-mount 26 hpf embryos, anterior to left, showing the two otic vesicles and midline tissue expressing ptc2. (A,B) Levels of ptc2 expression are slightly raised in ptc1-/- homozygotes compared with sibling embryos. (C,D) Levels of ptc2 are increased considerably in ptc1-/-; lep-/- double homozygotes compared with siblings. The genotype of ptc1-/- embryos was confirmed by PCR. Scale bar: 50 μm. |
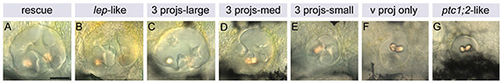
Phenotypes obtained from application of cyclopamine to ptc1-/-; lep-/- embryos from time points between 17S and 48 hpf. (A-G) Lateral views of live, 80 hpf ears taken using DIC optics. Corresponding data are shown in Table 3. When cyclopamine was applied from 17S, rescue of the ptc1-/-; lep-/- otic phenotype was complete (A). When applied from 48 hpf, the ears remained ptc1-/-; lep-/--like (G). From time points in between, the later the cyclopamine was applied, the less complete the rescue (B-F). Anterior to left, dorsal to top. Scale bar: 50 μm. 3 projs, all three canal projections present; ptc1;2, ptc1-/-; lep-/-; v proj, only ventral projection present. |
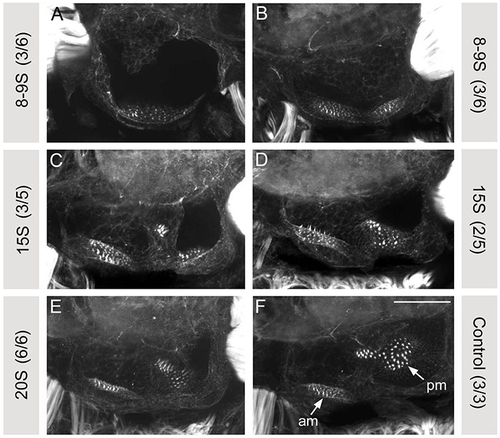
Hedgehog signalling is required before 15S for correct anteroposterior patterning of the zebrafish otic vesicle. (A-F) Merged confocal z-stacks of maculae stained with FITC-phalloidin to reveal the actin-rich stereocilia of the sensory hair cells at 84 hpf. Lateral views: anterior to left, dorsal to top. 50 μM cyclopamine was applied to wild-type (A,B) embryos from the time shown in the grey box until 24 hpf. When cyclopamine was applied from 8-9S, the resulting otic vesicles resembled those of smo-/- (A, 3/6 embryos) or con-/- (B, 3/6 embryos) embryos, which are both severe Hh loss-of-function mutants (Hammond et al., 2003). When cyclopamine was applied from later stages (C-F), the Hh loss-of-function otic phenotypes were not fully phenocopied. Numbers in parentheses in the grey boxes show the proportion of embryos displaying the phenotype shown. Scale bar: 50 μm. am, anterior (utricular) macula; pm, posterior (saccular) macula. |