
|
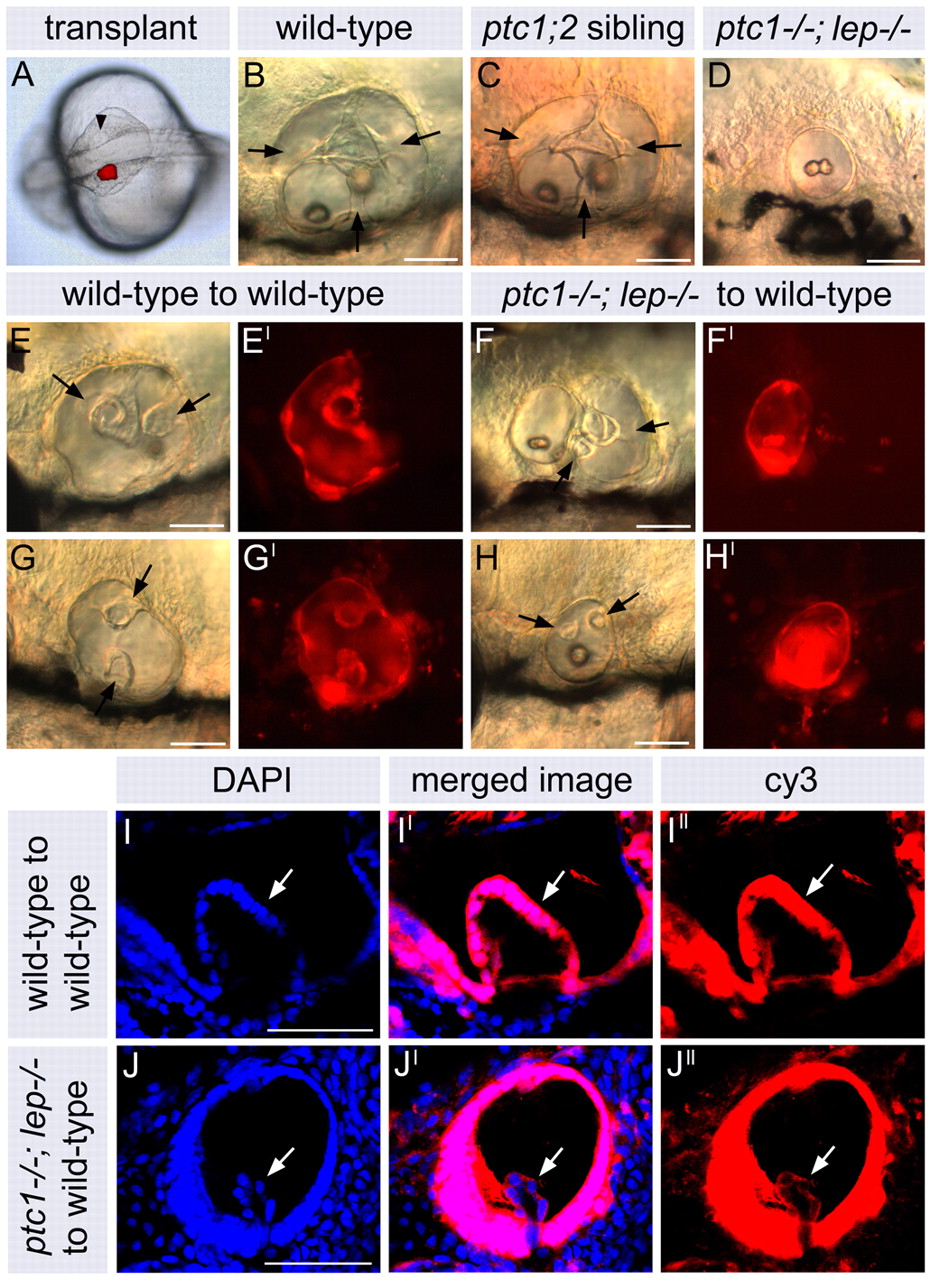
Fig. 7 Transplanted ptc1-/-; lep-/- otic tissue does not contribute to semicircular canal projections. (A) Dorsal view of a live 20S embryo immediately post-transplant. Rhodamine-dextran-labelled donor otic tissue was visualized fluorescently and is shown as a red overlay. Transplanted tissue was placed directly opposite the unlabelled host ear (arrowhead). (B-D) DIC images of live, untransplanted ears at 3 dpf. Arrows indicate semicircular canal pillars. Embryos in C and D were injected with rhodamine-dextran at the one- to two-cell stage. (E-H′) DIC images of live, transplanted otic vesicles at 3 dpf (E-H) and fluorescent images revealing the rhodamine-dextran-labelled donor tissue (E′-H′). Arrows in E and G indicate development of semicircular canal projection and pillar tissue in transplanted wild-type ears. (F,F′) Example of a ptc1-/-; lep-/- transplant in which both ptc1-/-; lep-/- and wild-type otic tissue are present: the ptc1-/-; lep-/- tissue has formed a small, separate otic vesicle containing no semicircular canal projection tissue. Arrows in F indicate semicircular canal projection and pillar tissue derived from the unlabelled host. (H,H′) Example of a transplanted ptc1-/-; lep-/- ear in which a single otic vesicle is present and which contains semicircular canal projection tissue (arrows). This is derived from host tissue (see J-J′). (I-J′) Confocal sections through semicircular canal projection tissue in a wild-type transplant (I-I′) and a ptc1-/-; lep-/- transplant (J-J′). (I,J) DAPI stain revealing the nuclei of each cell; (I′,J′) Cy3-tyramide-labelled biotin-dextran marking transplanted tissue. (I-I′) Semicircular canal projection tissue in transplanted wild-type otic vesicles (arrow) is labeled with Cy3 and derived from transplanted donor tissue. (J-J′) Semicircular canal projection tissue in transplanted ptc1-/-; lep-/- otic vesicles is unlabelled and derived from the host. All lateral views; anterior to left, dorsal to top. Scale bars: 50 μm in A-H; 25 μm in I-J′.