
- Title
-
A Foxf1-Wnt-Nr2f1 cascade promotes atrial cardiomyocyte differentiation in zebrafish
- Authors
- Coppola, U., Saha, B., Kenney, J., Waxman, J.S.
- Source
- Full text @ PLoS Genet.
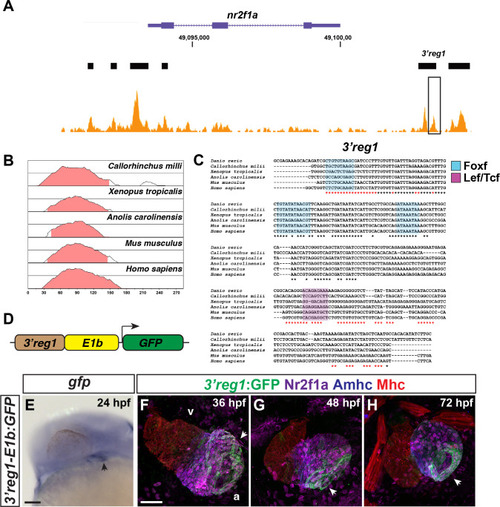
The |
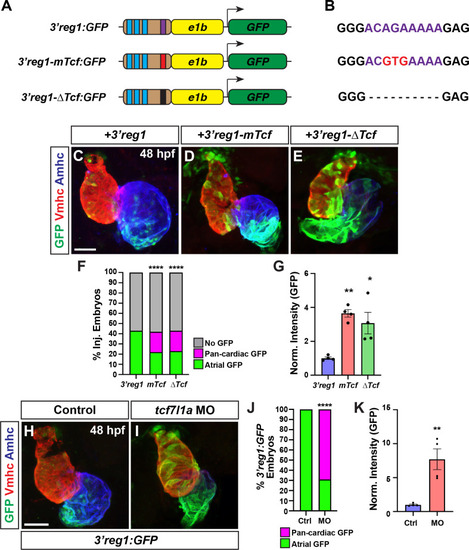
Tcf7l1a restricts |

Tcf7l1a limits Nr2f1a+ cardiomyocytes within the heart. |
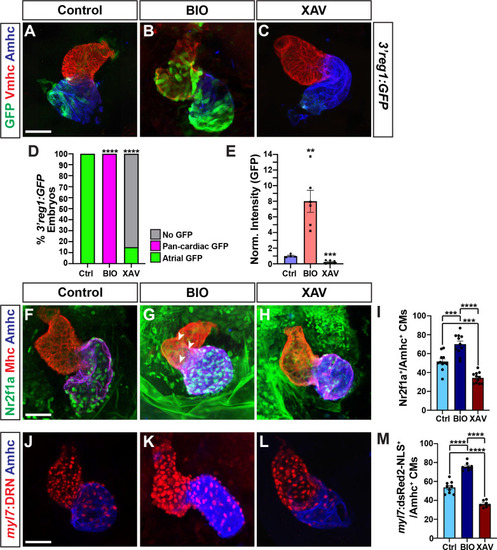
Wnt signaling promotes |
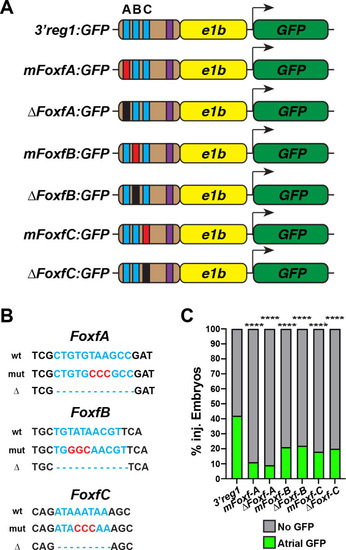
Foxf1 sites are required for |
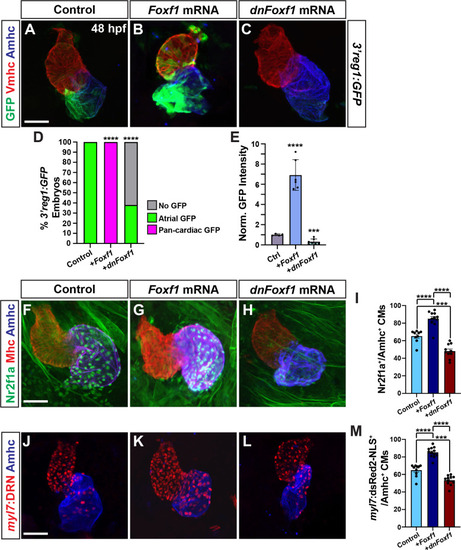
Foxf1 promotes |
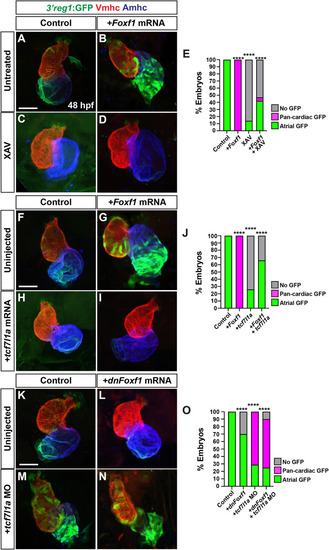
Tcf7l1a limits the ability of Foxf1 to promote |
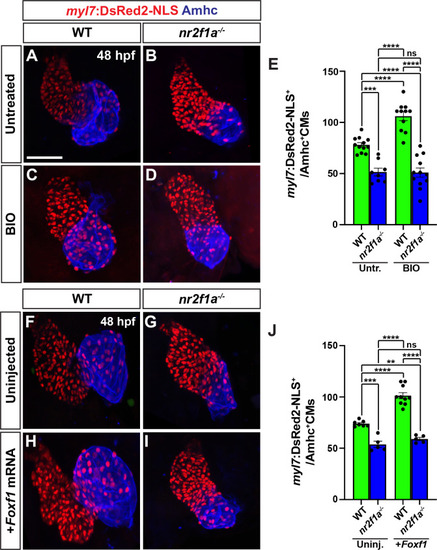
Wnt signaling and Foxf1 require Nr2f1a to promote a surplus of cardiomyocytes. |
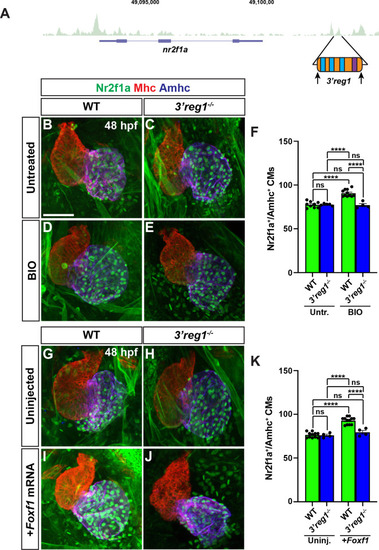
Wnt signaling and Foxf1 require 3 |
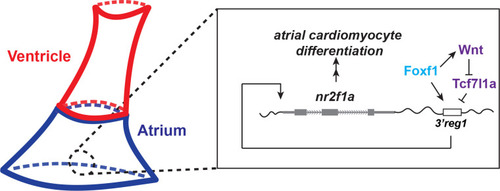
A Wnt-Foxf1-Nr2f1a cascade directs atrial cardiomyocyte differentiation. Model depicting the Foxf1 and Wnt signaling-dependent regulatory network that controls Nr2f1a expression and the role of the |