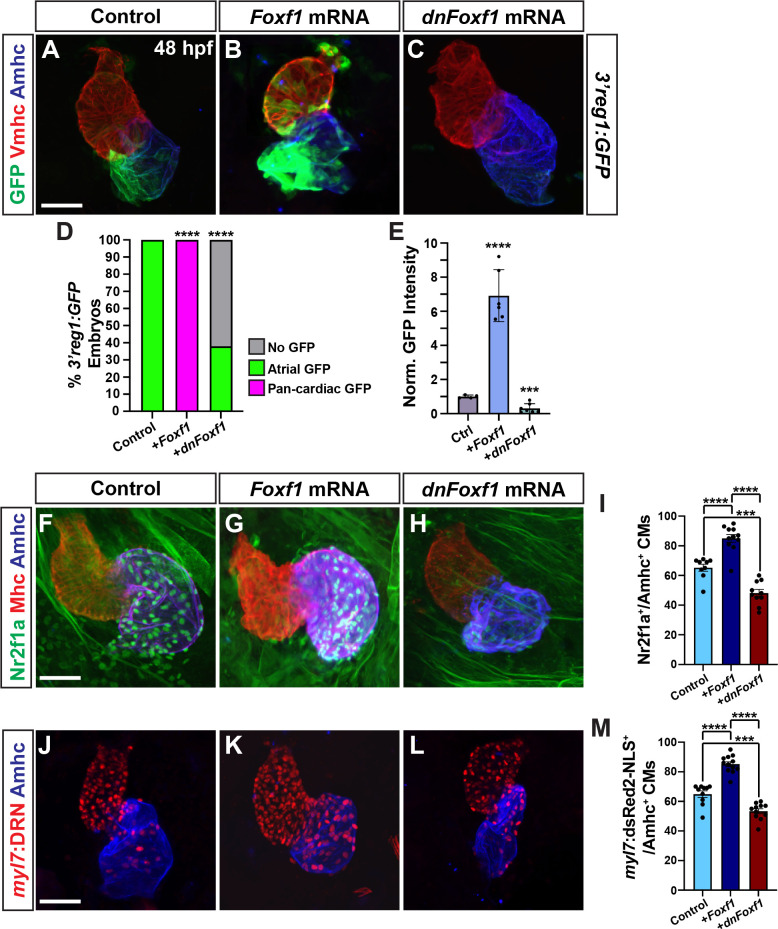
IMAGE

Fig 6

ID
ZDB-IMAGE-241119-62
Source
Figures for Coppola et al., 2024
Image
Figure Caption

Fig 6 Foxf1 promotes 3’reg1 reporter expression within the heart.

A-C) Confocal images of hearts from control uninjected, Foxf1 mRNA, and dnFoxf1 mRNA injected 3’reg1:GFP embryos stained for 3’reg1:GFP (green), Vmhc (red), Amhc (blue). D) The percentage of injected 3’reg1:GFP embryos with atrial expression, pan-cardiac expression, and lacking expression. Control (n = 35); Foxf1 mRNA (n = 29); dnFoxf1 mRNA (n = 59). E) Normalized intensity of GFP expression in hearts of injected 3’reg1:GFP embryos. Control (n = 4); Foxf1 mRNA (n = 6); dnFoxf1 mRNA (n = 7). F-H) Confocal images of hearts from control, Foxf1 mRNA, and dnFoxf1 mRNA injected embryos stained for Nr2f1a (green), Mhc (red), Amhc (blue). I) The number of Nr2f1a+/Amhc+ cardiomyocytes (ACs) within the hearts of control, Foxf1 mRNA, and dnFoxf1 injected embryos. Control (n = 8); Foxf1 (n = 11); dnFoxf1 (n = 8). J-L) Confocal images of hearts from control, Foxf1 mRNA, and dnFoxf1 injected myl7:DsRed2-NLS (myl7:DRN) embryos stained for DsRed-NLS (red) and Amhc (blue). M) Quantification of the number of myl7:DsRed2-NLS+/Amhc+ cardiomyocytes (ACs) within the hearts of control, Foxf1 mRNA, and dnFoxf1 injected myl7:DsRed2-NLS embryos. Control (n = 10); Foxf1 (n = 13); dnFoxf1 (n = 11). Scale bars: 50 μm. Error bars in graphs indicate s.e.m. *** indicate P < 0.001. **** indicate P < 0.0001.

Acknowledgments
This image is the copyrighted work of the attributed author or publisher, and ZFIN has permission only to display this image to its users. Additional permissions should be obtained from the applicable author or publisher of the image. Full text @ PLoS Genet.