|
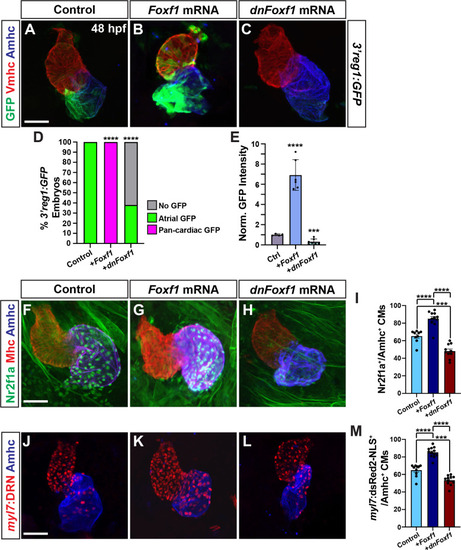
Foxf1 promotes 3’reg1 reporter expression within the heart. A-C) Confocal images of hearts from control uninjected, Foxf1 mRNA, and dnFoxf1 mRNA injected 3’reg1:GFP embryos stained for 3’reg1:GFP (green), Vmhc (red), Amhc (blue). D) The percentage of injected 3’reg1:GFP embryos with atrial expression, pan-cardiac expression, and lacking expression. Control (n = 35); Foxf1 mRNA (n = 29); dnFoxf1 mRNA (n = 59). E) Normalized intensity of GFP expression in hearts of injected 3’reg1:GFP embryos. Control (n = 4); Foxf1 mRNA (n = 6); dnFoxf1 mRNA (n = 7). F-H) Confocal images of hearts from control, Foxf1 mRNA, and dnFoxf1 mRNA injected embryos stained for Nr2f1a (green), Mhc (red), Amhc (blue). I) The number of Nr2f1a+/Amhc+ cardiomyocytes (ACs) within the hearts of control, Foxf1 mRNA, and dnFoxf1 injected embryos. Control (n = 8); Foxf1 (n = 11); dnFoxf1 (n = 8). J-L) Confocal images of hearts from control, Foxf1 mRNA, and dnFoxf1 injected myl7:DsRed2-NLS (myl7:DRN) embryos stained for DsRed-NLS (red) and Amhc (blue). M) Quantification of the number of myl7:DsRed2-NLS+/Amhc+ cardiomyocytes (ACs) within the hearts of control, Foxf1 mRNA, and dnFoxf1 injected myl7:DsRed2-NLS embryos. Control (n = 10); Foxf1 (n = 13); dnFoxf1 (n = 11). Scale bars: 50 μm. Error bars in graphs indicate s.e.m. *** indicate P < 0.001. **** indicate P < 0.0001.
|