
- Title
-
Pax2a, Sp5a and Sp5l act downstream of Fgf and Wnt to coordinate sensory-neural patterning in the inner ear
- Authors
- Tan, A.L., Mohanty, S., Guo, J., Lekven, A.C., Riley, B.B.
- Source
- Full text @ Dev. Biol.
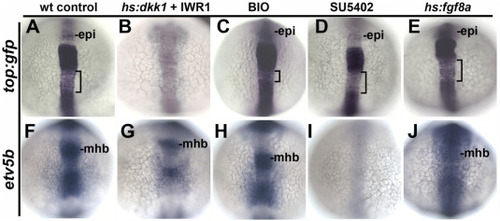
Early responses to modulation of Wnt and Fgf. (A–J) Dorsal views (anterior to the top) showing expression at 14 hpf of the artificial Wnt reporter top:gfp (A–E) and the Fgf-target gene etv5b (F–J) following treatment at 12 hpf with DMSO (control), hs:dkk1 (39 °C for 1 h) + 10 μM IWR-1 added immediately after heat shock, BIO (5 μM), SU5402 (70 μM), or hs:fgf8a (39 °C for 1 h). Epiphysis (epi) and midbrain-hindbrain border (MHB) are indicated. Brackets mark a zone of weaker top:gfp expression in the hindbrain. The same conditions were used in subsequent figures, except for changes in treatment duration and time of fixation as noted. EXPRESSION / LABELING:
PHENOTYPE:
|
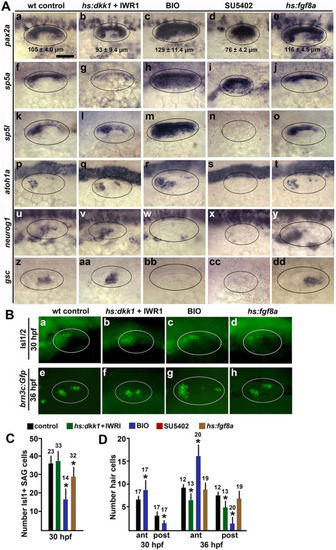
Effects of altered Wnt and Fgf signaling on sensory-neural patterning in the otic vesicle. (A) Dorsolateral views (anterior to the left) showing expression of otic markers of the medial wall, sensory epithelia and neurogenic domains (indicated on the left) at 24 hpf following treatments to alter Wnt and Fgf signaling at 12 hpf. Oval marquees encircle the otic vesicle. Mean anteroposterior length of the otic vesicle (±SD, n ≥ 8) is indicated in images of pax2a expression (Aa-e). Scale bar (Aa), 50 μm. (B) Dorsolateral views of anti-Isl1/2 stained SAG neurons at 30 hpf (a–d) and brn3c:Gfp + hair cells at 36 hpf (e–h) under the indicated conditions. (C, D) Quantification of the effects of signal modulation under conditions indicated by the key at the top. Mean values with errors (standard deviations) and sample sizes are indicated for each group. Asterisks indicate significant differences relative to controls. (C) Mean number of anti-Isl1/2 stained SAG neurons at 30 hpf. (D) Mean number of brn3c:gfp + hair cells in the anterior and posterior sensory epithelia at 30 and 36 hpf. |
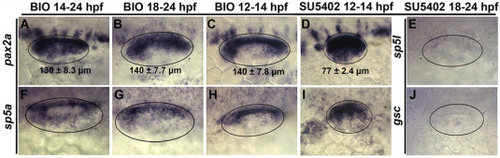
Effects of timing of treatments in altering otic patterning. (A– J) Dorsolateral views (anterior to the left) showing expression of otic markers (indicated on the left) at 24 hpf following shorter duration treatment times (indicated at the top) to determine temporal requirements for altered patterning by Wnt and Fgf. Oval marquees encircle the otic vesicle; mean anteroposterior length (±SD, n ≥ 8) is indicated in the pax2a expression images (A–D). |
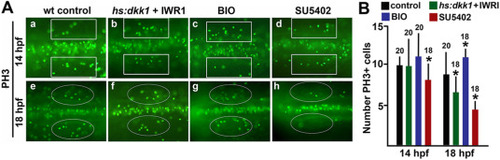
Effects on proliferation. (A) Dorsal view of embryos stained for phospho-histone H3 to label mitotic cells at 14 and 18 hpf under conditions indicated at the top of the panel. Marquees around the otic placode (200 μm × 50 μm rectangles) or otic vesicle (ovals) were used for quantitation. Ovals delimit the edges of the otic vesicle. (B) Mean number of cells stained with anti-PH3 inside the marquees shown in (A) at 14 and 18 hpf. PHENOTYPE:
|
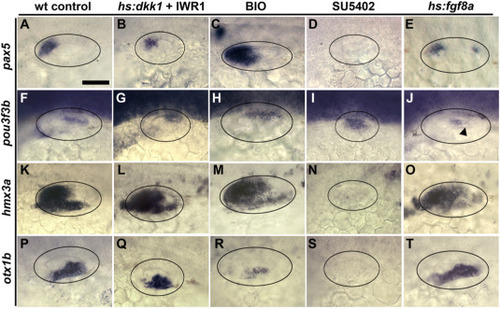
Effects of altered Wnt and Fgf on regional identity. (A–T) Dorsal views showing regional otic markers (indicated on the left) at 24 hpf following treatments from 12 hpf as indicated at the top. The black arrowhead in (J) marks a posterior domain of pou3f3b that is lost following activation of hs:fgf8a. |
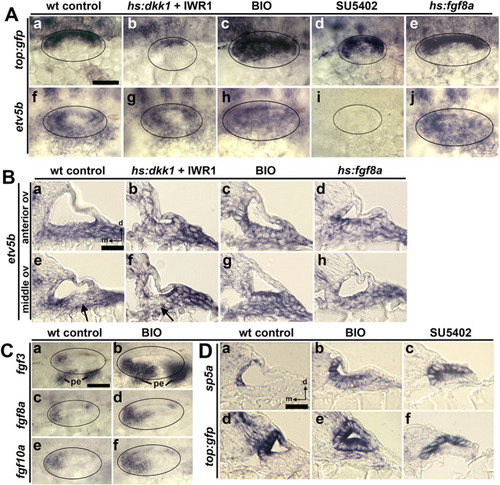
Effects of signal modulation on reporters of Fgf and Wnt signaling. (A) Dorsolateral views showing expression of Wnt reporter top:gfp (a–e) or Fgf-target etv5b (f–j) at 24 hpf under conditions indicated at the top. (B) Cross-sections (dorsal to the top, medial to the left) of etv5b-stained embryos passing through the anterior or middle the otic vesicle, as indicated on the left. Black arrows (e, f) indicate regions of weaker expression of etv5b. (C) Dorsolateral views showing expression of fgf3, fgf8a and fgf10a at 24 hpf in control and BIO-treated embryos. Pharyngeal endoderm (pe) is marked (Ca, Cb). (D) Cross-sections of embryos showing expression of sp5a and top:gfp at 24 hpf following treatments from 12 hpf, as indicated at the top. Scale bars (Aa, Ba, Ca, Da), 50 μm. |
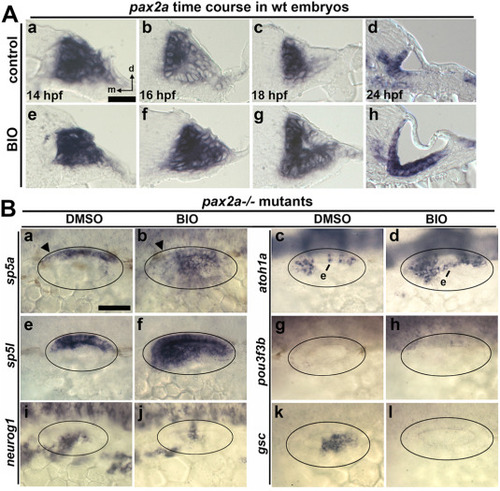
Effects of BIO on pax2a expression and otic patterning in pax2a mutants. (A) Cross sections (dorsal to the top, medial to the left) showing expression of pax2a at the indicated times in controls and embryos treated with BIO from 12 hpf. (B) Dorsolateral views showing expression of otic markers (as indicated on the left) at 24 hpf after incubation with DMSO (control) or BIO from 12 hpf as indicated at the top. Black arrowheads (Ba, Bb) show regions where sp5a expression is downregulated relative to wild-type embryos. Ectopic expression (e) of atoh1a is indicated (Bc, Bd). Scale bar, 50 μm. EXPRESSION / LABELING:
PHENOTYPE:
|
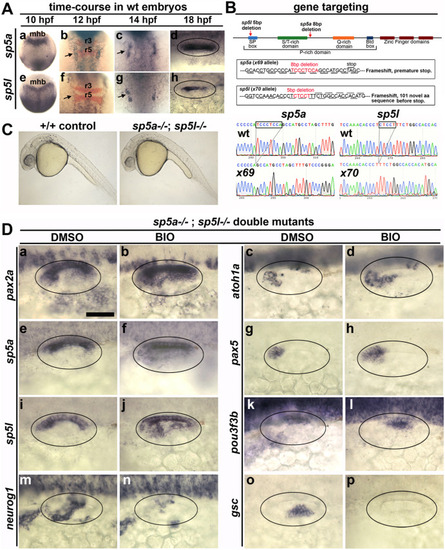
Early expression of sp5a and sp5l and effects of disruption on otic patterning. (A) Dorsal views with anterior to the top (Aa-c, Ae-Ag) and dorsal views with anterior to the left (Ad, Ah) showing expression of sp5a and sp5l in wild type embryos at the times indicated at the top. Co-staining for krox20 (red) is shown at 12 hpf (Ab, Af) to mark positions of rhombomeres 3 and 5 (r3, r5) in the hindbrain. The midbrain-hindbrain border (mhb) is labeled. Arrows point to otic domains (Ab, Ac, Af, Ag). (B) Targeting of sp5a and sp5l. The upper diagram represents the general layout of both genes, including regions encoding specific peptide domains. Red arrows show relative positions of deletions induced by CRISPR/Cas9 cutting. Altered sequences in mutant alleles sp5ax69 and sp5lx70 are shown in boxed regions and in sequencing traces at the bottom. (C) Lateral views of live wild-type and sp5a−/−; sp5l−/− embryos at 24 hpf. (D) Dorsolateral views of sp5a−/−; sp5l−/− double mutants showing expression at 24 hpf of various otic genes (as indicated on the left) following treatment with DMSO or BIO from 12 hpf (as indicated at the top). Scale bar, 50 μm. |
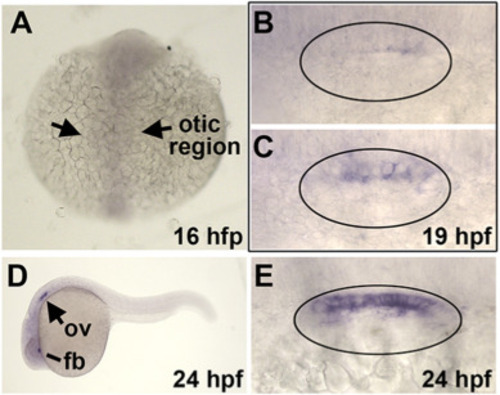
Expression of sp5b. (A) Dorsal view showing absence of sp5b staining at 16 hpf. The otic region is indicated. (B, C) Dorsal views (anterior to the left) showing variable weak expression of sp5b in the medial wall of the otic vesicle at 19 hpf. (D) Lateral view showing expression of sp5b in the otic vesicle (ov) and forebrain (fb) at 24 hpf. (E) Dorsal view showing sp5b expression in the medial wall of the otic vesicle at 24 hpf. EXPRESSION / LABELING:
|
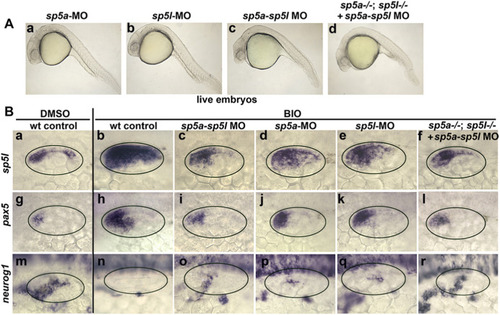
Analysis of sp5a and sp5l morphants. (A) Lateral views of live embryos at 24 hpf following injection at the one-cell stage with sp5a-MO and/or sp5l-MO, as indicated at the top. (B) Dorsal lateral views showing expression of genes indicated at the left under conditions indicated at the top. |
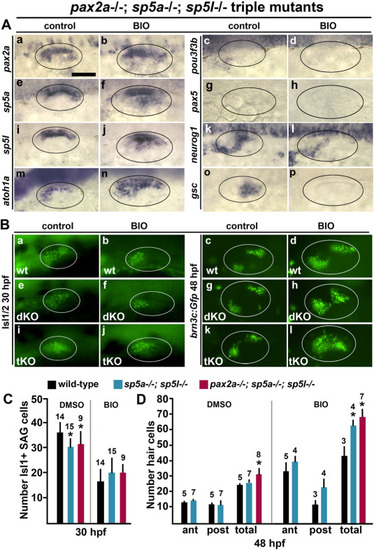
Effects of loss of pax2a, sp5a, and sp5l on otic patterning. (A) Dorsolateral views of pax2a−/−; sp5a−/−; sp5l−/− triple mutants showing expression of otic markers at 24 hpf (as indicated on the left) following treatment with DMSO (control) or BIO from 12 hpf. Scale bar (Aa), 50 μm. (B) Dorsolateral views of anti-Isl1/2 stained SAG neurons at 30 hpf (a, b, e, f, i, j) and brn3c:Gfp + hair cells at 48 hpf (c, d, g, h, k, l) under the indicated conditions. Ovals delimit the edges of the otic vesicle. Genotypes of +/+ (wt), sp5a−/−; sp5l−/− double mutants (dKO, double knockouts) and pax2a−/−; sp5a−/−; sp5l−/− triple mutants (tKO, triple knockouts) are indicated. (C, D) Quantification of SAG neurons and hair cells in wild-type embryos, sp5a−/−; sp5l−/− double mutants, and pax2a−/−; sp5a−/−; sp5l−/− triple mutants (as indicated by the key at the top) following treatment with DMSO or BIO from 12 hpf, as indicated. Data show the mean number of anti-Isl1/2 stained SAG neurons (C) and phalloidin stained hair cells in anterior/utricular and posterior/saccular maculae (D). Error bars (standard deviations) and sample sizes are shown for each group, and asterisks indicate significant differences from wild-type embryos for each treatment. Note, it was not possible to identify anterior and posterior patches of hair cells in triple mutants, which produced an unbroken swath of hair cells along the AP axis. |
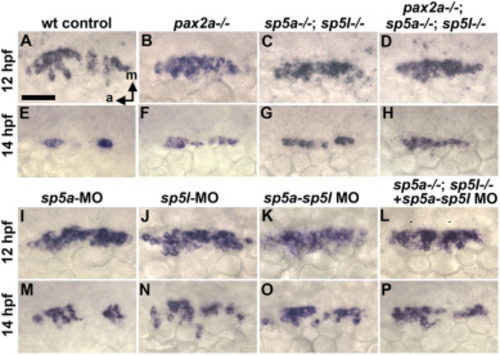
Effects of sp5a and sp5l knockdown on early prosensory development. (A–H) Dorsal views (medial to the top, anterior to the left) of otic tissue showing expression of atoh1b at 12 and 14 hpf in wild-type control embryos, pax2a−/− mutants, sp5a−/−; sp5l−/− double mutants, and pax2a−/−; sp5a−/−; sp5l−/− triple mutants. Scale bar (A), 50 μm. (I–P) Dorsal views (anterior to left) showing expression of atoh1b at 12 and 14 hpf following injection of sp5a-MO and/or sp5l-MO at the one-cell stage, as indicated at the top. EXPRESSION / LABELING:
PHENOTYPE:
|
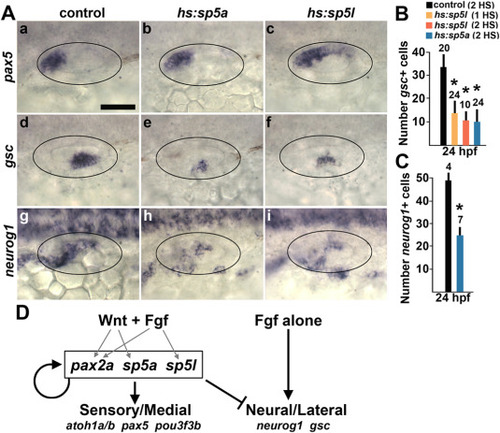
Effect of misexpression of sp5a and sp5l on sensory and neural development. (A) Dorsolateral views showing expression of pax5, gsc, and neurog1 at 24 hpf following serial activation of hs:sp5a or hs:sp5l at 12 hpf and 14 hpf. Scale bar (Aa), 50 μm. (B, C) Quantification of the mean number of gsc + cells counted in wholemount embryos (B) and the mean number of neurog1+ cells in the otic vesicle counted from serial sections. Embryos were exposed to a single heat shock at 12 hpf (1HS) or serial heat shocks at 12 hpf and 14 hpf (2HS), as indicated in the key at the top. Error bars (standard deviations) and sample sizes are shown for each group. Asterisks indicate a significant difference from control embryos. (D) Summary of regulation of sensory-neural patterning by Fgf and Wnt. Gray arrows show regulation by Fgf and/or Wnt of medial factors pax2a, sp5a and sp5l, which help upregulate and maintain their own expression and promote aspects of sensory development, and are required to repress neurogenesis otherwise activated by Fgf. EXPRESSION / LABELING:
|
Reprinted from Developmental Biology, 492, Tan, A.L., Mohanty, S., Guo, J., Lekven, A.C., Riley, B.B., Pax2a, Sp5a and Sp5l act downstream of Fgf and Wnt to coordinate sensory-neural patterning in the inner ear, 139-153, Copyright (2022) with permission from Elsevier. Full text @ Dev. Biol.