
- Title
-
Morphological, behavioral and cellular analyses revealed different phenotypes in Wolfram syndrome wfs1a and wfs1b zebrafish mutant lines
- Authors
- Crouzier, L., Richard, E.M., Diez, C., Alzaeem, H., Denus, M., Cubedo, N., Delaunay, T., Glendenning, E., Baxendale, S., Liévens, J.C., Whitfield, T.T., Maurice, T., Delprat, B.
- Source
- Full text @ Hum. Mol. Genet.
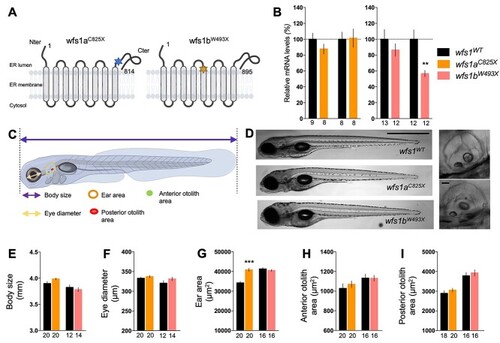
Characterization of |
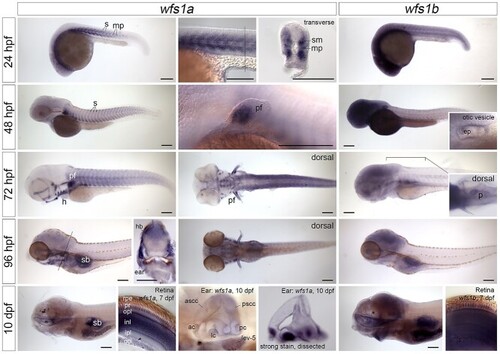
Expression of |
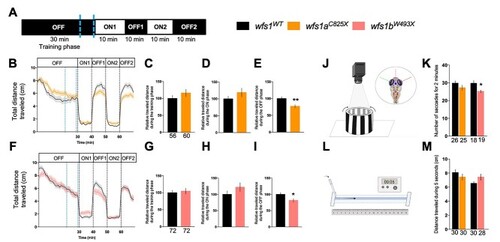
Behavioral analyses of 5 dpf PHENOTYPE:
|
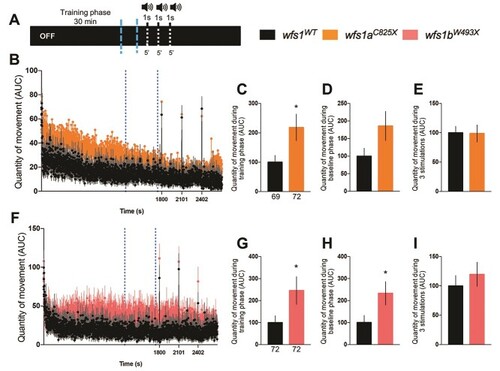
Analysis of the quantity of movement of 5 dpf PHENOTYPE:
|
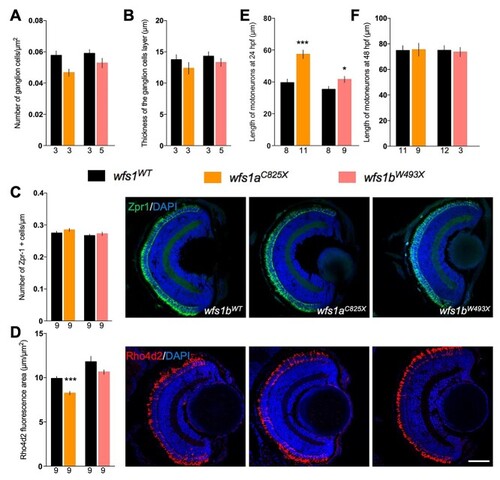
Molecular characterization of the retina and measure of the motor neuron length for both |
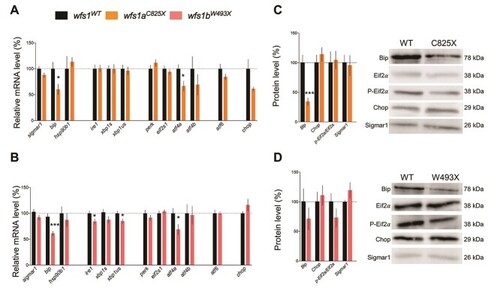
Relative mRNA and protein expression levels of larvae zebrafish ER stress factors in physiological condition at 5 dpf. mRNA levels were analyzed by qPCR and protein contents by western blot in ( |
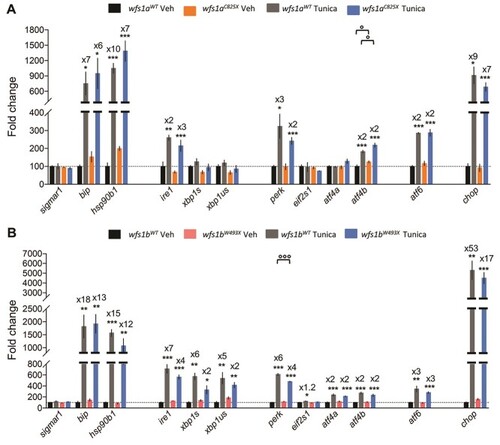
Relative gene expression levels of ER stress factors in zebrafish larvae at 5 dpf exposed to tunicamycin during 24 h. Expression analysis of the selected genes using cDNA prepared from |
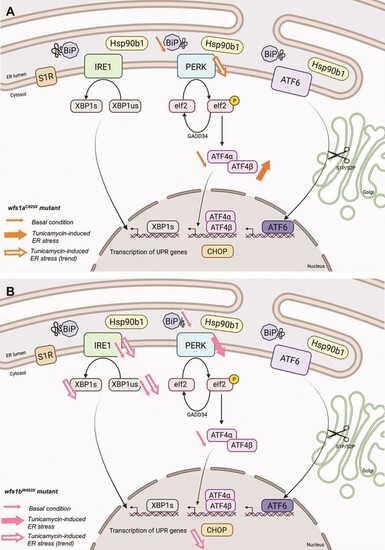
Schematic summary of ER stress pathways alterations observed in basal condition or after tunicamycin treatment in |
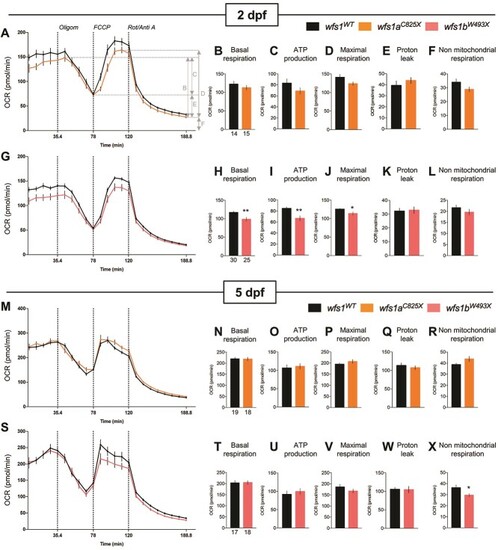
Analysis of mitochondrial respiration in zebrafish larvae at 2 and 5 dpf with Seahorse XF mito stress test. OCR profiles of ( |