
Image
|
Figure Caption
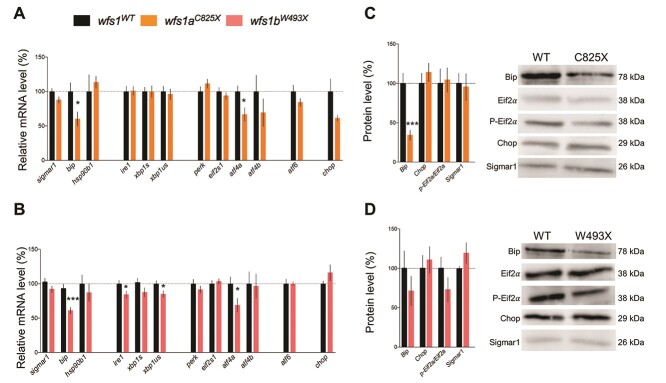
Figure 6
Relative mRNA and protein expression levels of larvae zebrafish ER stress factors in physiological condition at 5 dpf. mRNA levels were analyzed by qPCR and protein contents by western blot in (
Figure Data
Acknowledgments
This image is the copyrighted work of the attributed author or publisher, and
ZFIN has permission only to display this image to its users.
Additional permissions should be obtained from the applicable author or publisher of the image.
Full text @ Hum. Mol. Genet.