
FIGURE
Figure 9
- ID
- ZDB-FIG-220827-22
- Publication
- Crouzier et al., 2022 - Morphological, behavioral and cellular analyses revealed different phenotypes in Wolfram syndrome wfs1a and wfs1b zebrafish mutant lines
- Other Figures
- All Figure Page
- Back to All Figure Page
Figure 9
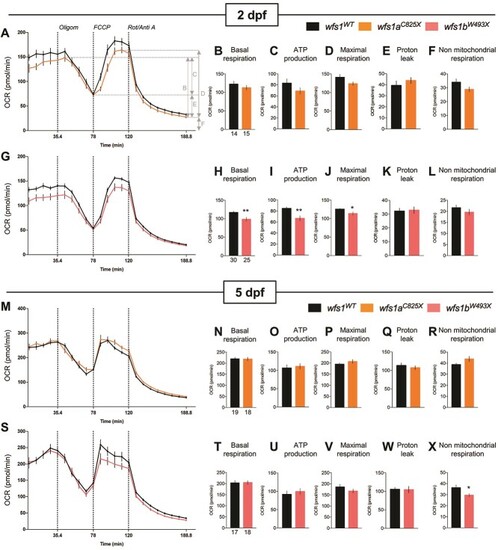
Analysis of mitochondrial respiration in zebrafish larvae at 2 and 5 dpf with Seahorse XF mito stress test. OCR profiles of ( |
Expression Data
Expression Detail
Antibody Labeling
Phenotype Data
| Fish: | |
|---|---|
| Observed In: | |
| Stage Range: | Long-pec to Day 5 |
Phenotype Detail
Acknowledgments
This image is the copyrighted work of the attributed author or publisher, and
ZFIN has permission only to display this image to its users.
Additional permissions should be obtained from the applicable author or publisher of the image.
Full text @ Hum. Mol. Genet.