|
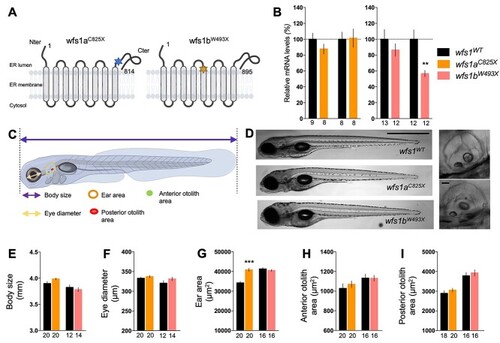
Characterization of wfs1 mutant zebrafish lines. (A) Schematic molecular structure of Wfs1a and Wfs1b proteins with mutation. The stars represent the punctual mutations, blue for Wfs1a mutation and orange for Wfs1b. (B) Relative wfs1a and wfs1b mRNA levels assessed by qPCR in wfs1aC825X and wfs1bW493X zebrafish larvae, normalized against zef1α reference gene. (C) Schematic representation of the different measurements of the larva. (D) Representative images of wild-type and homozygous mutant wfs1 larvae. Images to the right show the ear in the wild-type (upper image) and wfs1aC825X mutant (the lower image). (E) Measurement of body size, (F) eye diameter, (G) ear area in lateral view, (H) anterior and (I) posterior otoliths area. Scale bars, 200 μm in (D), 10 μm in the insets. Error bars represent mean ± SEM and the number of fish is indicated below the columns. **P < 0.01, ***P < 0.0001; unpaired t-test.
|