FIGURE

Figure 3

ID
ZDB-FIG-220827-16
Publication
Crouzier et al., 2022 - Morphological, behavioral and cellular analyses revealed different phenotypes in Wolfram syndrome wfs1a and wfs1b zebrafish mutant lines
Other Figures
All Figure Page
Back to All Figure Page
Figure 3

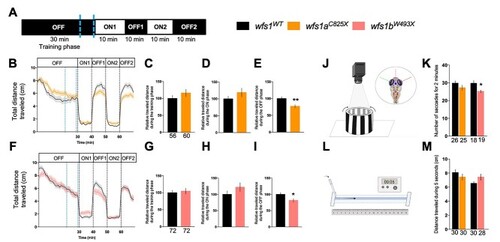
Behavioral analyses of 5 dpf wfs1 mutant larvae. (A) Light protocol: the activity is measured for 70 min, with 30 min of training in the dark (OFF), then two cycles of light/dark (ON/OFF) of 10 min each. Analysis of the distance traveled by (B) the wfs1aC825X and (F) wfs1bW493X larvae at 5 dpf during the light/dark cycle in the VMR test. Relative distance traveled was measured during some experiment phases as (C, G) the training phase [blue-dotted lines in (B, F) between 21 and 29 min]; (D, H) the ON phase (the averaged ON1 and ON2 phases); (E, I) the OFF phase (the averaged OFF1 and OFF2 phases). (J) Illustration of the OKR test. Four larvae are immobilized in petri dish and placed in an arena with moving black and white gratings. (K) The number of saccades performed in 2 min. (L) Illustration of the touch escape test. The larva’s tail is touched with a tip and (M) the traveled distance of the larva in the rail is measured for 5 s, repeated for three times per larva and averaged. Relative distances were expressed as % of associated controls. Error bars represent ± SEM calculated from three replicas. The number of animals is indicated below the columns. *P < 0.05; **P < 0.01; unpaired t-test.

Expression Data

Expression Detail
Antibody Labeling
Phenotype Data
Fish:
Conditions:
Observed In:
Stage: Day 5

Phenotype Detail
Acknowledgments
This image is the copyrighted work of the attributed author or publisher, and ZFIN has permission only to display this image to its users. Additional permissions should be obtained from the applicable author or publisher of the image. Full text @ Hum. Mol. Genet.