IMAGE

Figure 9

ID
ZDB-IMAGE-220827-24
Source
Figures for Crouzier et al., 2022
Image
Figure Caption

Figure 9

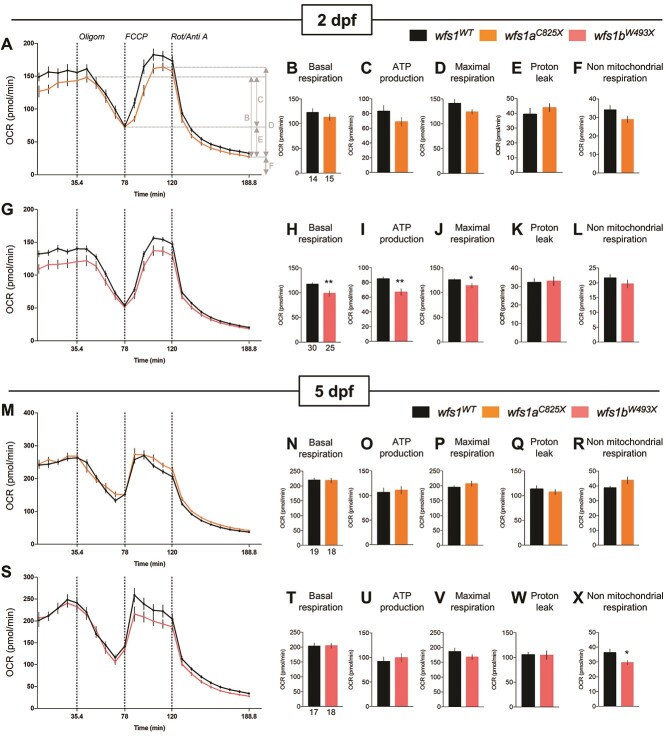
Analysis of mitochondrial respiration in zebrafish larvae at 2 and 5 dpf with Seahorse XF mito stress test. OCR profiles of (AL) wfs1aC825X at 2 dpf (A–F) and 5 dpf (G–L); and OCR profiles of (MX) wfs1bW493X at 2 dpf (M–R) and 5 dpf (S–X) during the assay, with (B, H) basal respiration, (C, I) ATP production, (D, J) maximal respiration, (E, K) proton leak and (F, L) non-mitochondrial respiration. Error bars represent ± SEM calculated from three replicas. The number of animals is indicated below the columns. *P < 0.05, **P < 0.01; unpaired t-test.

Figure Data
Acknowledgments
This image is the copyrighted work of the attributed author or publisher, and ZFIN has permission only to display this image to its users. Additional permissions should be obtained from the applicable author or publisher of the image. Full text @ Hum. Mol. Genet.