IMAGE

Figure 4

ID
ZDB-IMAGE-220827-19
Source
Figures for Crouzier et al., 2022
Image
Figure Caption

Figure 4

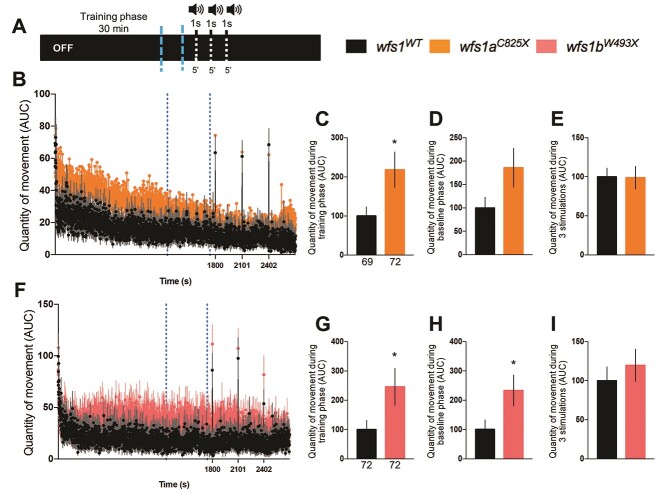
Analysis of the quantity of movement of 5 dpf wfs1 mutant larvae during the noise cycle in the ASR test. (A) Sound protocol: the activity is measured for 45 min in a total dark (OFF) condition, with a training phase for 30 min silently, then three cycles of white sounds (90 dB) of 1 s each and 5 min interspersed. Quantity of movement per second for (B) the wfs1aC825X and (F) wfs1bW493X larvae according to the sound protocol. Relative quantity of movement during (C, G) the training phase [blue-dotted lines in (B, F) between 21 and 29 min]; (D, H) the baseline phase, period of 2 min before each sound (the averaged three baseline phases); (E, I) the three stimulations (the averaged sounds phases). Activity was expressed as % of associated controls. Error bars represent ± SEM calculated from three replicas. The number of animals is indicated below the columns. *P < 0.05; unpaired t-test.

Figure Data
Acknowledgments
This image is the copyrighted work of the attributed author or publisher, and ZFIN has permission only to display this image to its users. Additional permissions should be obtained from the applicable author or publisher of the image. Full text @ Hum. Mol. Genet.