FIGURE SUMMARY
Title

Identification of a novel interaction of FUS and syntaphilin may explain synaptic and mitochondrial abnormalities caused by ALS mutations

Authors
Salam, S., Tacconelli, S., Smith, B.N., Mitchell, J.C., Glennon, E., Nikolaou, N., Houart, C., Vance, C.
Source
Full text @ Sci. Rep.

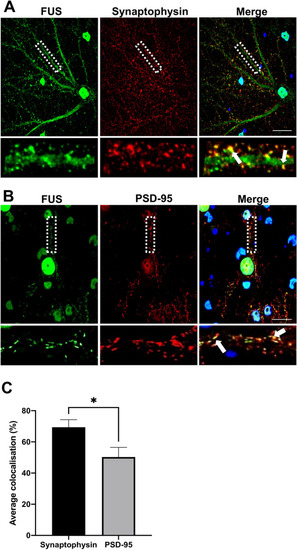
Subcellular localisation of FUS in primary cortical neurons. Immunofluorescent staining of DIV21 rat primary cortical neurons. (A) Representative confocal images of FUS (red) and presynaptic marker synaptophysin (SYN) (green) FUS was found to localise with synaptophysin puncta along neurites. (B) Representative confocal images of FUS (green) and the post synaptic marker PSD95 (Red). FUS was found to localise with PSD5 puncta along neurites. Selected regions of interest for A and B have been shown as magnifications as single and merged channels below the images of the respective neurons with white arrows indicating colocalisation. Nuclei are counterstained blue with DAPI. (C) Quantification of the subcellular localisation showed that FUS preferentially localised to the pre-synapse in these neurons (three neurites from nine different neurons from three independent experiments were analysed). *P < 0.05, unpaired students T-test. Scale bar = 20 μm.

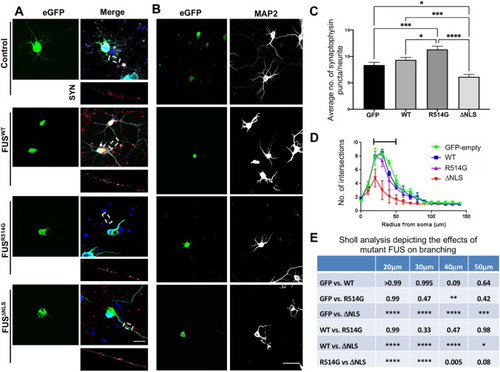
ALS-linked mutations in FUS lead to pre-synaptic alterations. (A) Representative confocal images of DIV8 rat primary cortical neurons transfected with eGFP, eGFP-FUSWT, eGFP-FUSR514G or eGFP-FUSΔNLS (green) and stained for synaptophysin (red) and MAP2 (merge). Overexpressed mutant FUS leads to differing levels of cytoplasmic mislocalisation for both eGFP-FUSR514G and eGFP-FUSΔNLS. Smaller images below show a representative region of interest used for quantification. Nuclei were counterstained with DAPI. Scale bar = 10 μm. (B) Representative confocal images showing mutation specific changes to dendritic branching. Left panels show eGFP expression (green), right panels show MAP2 staining (greyscale). Scale bar = 100 μm. (C) Quantitative analysis comparing the number of pre-synaptic puncta between each mutation and control. There is a significant increase in the number of SYN puncta in the neurons transfected with eGFP-FUSR514G compared to eGFP-FUSWT (p < 0.05) and a significant decrease in puncta in neurites expressing eGFP-FUSΔNLS (p < 0.0001). Statistical analysis was performed using a One-Way ANOVA with a post-hoc Tukey’s multiple comparisons test; error bars are ± SEM (n = three neurites from five cells per condition, three independent replicates). Data represent mean synaptophysin puncta on each dendrite per 10 μm ± SEM. (D,E) Sholl analysis revealed a significant change in branching between 20–50 μm away from the soma with the eGFP-FUS compared to all other conditions (n = ten transfected cells from three individual replicates). Statistical analysis was performed using a two-Way ANOVA with a multiple comparisons test which compared the simple effects within each row; error bars are ± SEM. Significant results are represented by the black bar and presented in the table (E). *p < 0.05, **p < 0.01, ***p < 0.001 ****p < 0.0001.

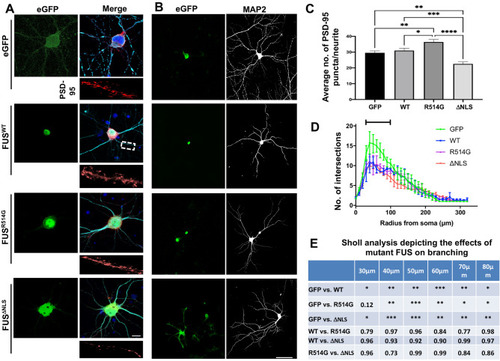
ALS-linked mutations in FUS lead to post synaptic alterations. Representative confocal images of DIV21 rat primary neurons transduced with eGFP, HA-FUSWT, HA-FUSR514G and HA-FUSΔNLS. Cells were stained for HA (green), PSD-95 (red) and MAP2 (merge). HA staining shows cytoplasmic mislocalisation of the mutant FUS. Regions of interest show magnified dendrites used to quantify the PSD-95. Nuclei were counterstained with DAPI. Scale bar = 10 μm. (B) Representative confocal images show HA-FUS expression (left) and dendritic branching shown by MAP2 (greyscale) staining (right). Scale bar = 100 μm. (C) Quantitative analysis comparing the average number of PSD-95 puncta per dendrite after transduction of WT and mutant FUS synaptic alterations. There was a significant increase in the number of PSD-95 puncta in the neurons expressing HA-FUSR514G compared to HA-FUSWT (P < 0.05) and a significant decrease in puncta for those cells expressing HA-FUSΔNLS compared to HA-FUSWT (P < 0.001). Statistical analysis was performed using a One-Way ANOVA with a post-hoc Tukey’s multiple comparisons test; error bars are ± SEM (n = three neurites from five cells per condition, three independent replicates). Data represent mean PSD-95 puncta on each dendrite per 10 μm ± SEM. Scale bar = 100 μm. (D,E) Quantitative analysis of dendritic branching after transduction with WT and mutant FUS. Sholl analysis revealed no overall significant change when assessing how dendritic branching was affected by WT or mutant FUS (n = ten transfected cells from three individual replicates). Statistical analysis was performed using a two-Way ANOVA with a multiple comparisons test which compared the simple effects within each row; error bars are ± SEM. *p < 0.05, **p < 0.01, ***p < 0.001 ****p < 0.0001.

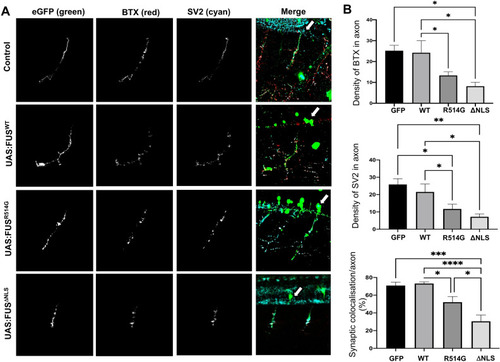
Zebrafish expressing mutant FUS show abnormal neuromuscular junctions and orphaned pre-synaptic endings. (A) Confocal images of long pec stage zebrafish trunk, lateral view, anterior to the right, imaged after microinjection with eGFP, eGFP-FUSWT, eGFP-FUSR514G or eGFP-FUSΔNLS. Merged images show the GFP-FUS (green) and SV2 (cyan) and BTX staining (red) which is indicated by a white arrow for each condition. Analysis was carried out on the greyscale images. Scale bar = 100 μm. (B) Quantitative analysis of the synaptic density of BTX, SV2 and synaptic colocalization. There was a significant reduction in the number of NMJs as shown by a reduction in both BTX (top) and SV2 (middle) staining in axons expressing eGFP-FUSR514G (p < 0.05) and eGFP-FUSΔNLS (p < 0.05) compared to eGFP-FUSWT. The colocalisation between the SV2 and the BTX (bottom) was also reduced in axons expressing eGFP-FUSR514G (p < 0.05) and eGFP-FUSΔNLS (p < 0.0001) compared to WT. Statistical analysis was performed using a One-Way ANOVA with a post-hoc Tukey’s multiple comparisons test; error bars are ± SEM. N = six different independent injections for each plasmid. *p < 0.05, **p < 0.01, ***p < 0.001 ****p < 0.0001.

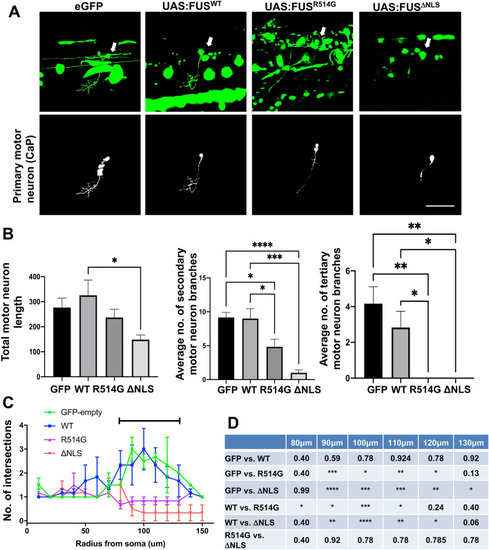
Mutant FUS expression in primary motor neurons affects axonal branching. (A) Confocal images of long pec stage zebrafish trunk microinjected with eGFP, eGFP-FUSWT, eGFP-FUSR514G or eGFP-FUSΔNLS. Images show the lateral view, anterior to the right. Top panels show an isolated GFP expressing motor neuron which are indicated by a white arrow (green) while bottom panels show a traced isolated motor neuron which was used to quantify axonal branching for each condition. Scale bar = 100 μm. (B) Quantitative analysis comparing total average axonal length where GFP-FUS is being expressed between each mutation and control injection (top left) shows a significant reduction in the eGFP-FUSΔNLS expressing length compare to eGFP-FUSWT. Data represent mean axonal length per 100 μm ± SEM. Analysis of the average number of secondary axonal branches (top right) showed a significant decrease in axons expressing eGFP-FUSR514G (p < 0.05) and eGFP-FUSΔNLS (p < 0.001) compared to eGFP-FUSWT. Data represent mean number of secondary axonal branches per 100 μm ± SEM. When analysis was undertaken of the number of tertiary axonal branches (bottom), it was clear that whilst numbers were low, there were no tertiary branches in axons expressing eGFP-FUSR514G or eGFP-FUSΔNLS. Data represent mean number of tertiary axonal branches per 100 μm ± SEM was also compared between conditions. (C,D) Quantitative analysis of axonal branching after microinjection of eGFP-FUSWT and mutant FUS in primary motor axons. Sholl analysis revealed a significant change between 80–130 μm away from the soma when assessing how axonal branching was affected by eGFP-FUSWT or mutant FUS. Statistical analysis was performed using a two-Way ANOVA with a multiple comparisons test which compared the simple effects within each row; error bars are ± SEM. Significant results (represented by bar in C) are presented in the table (D). N = six different independent injections for each plasmid.

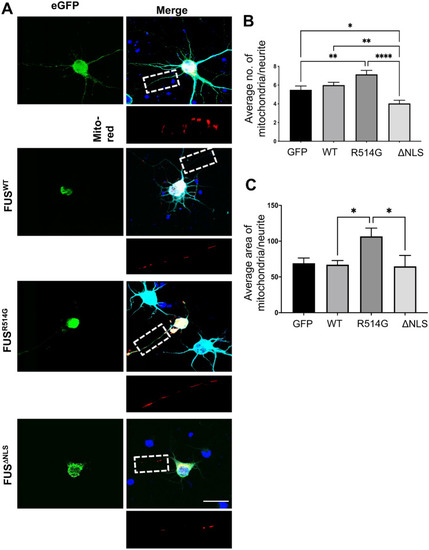
Expression of mutant FUS leads to mitochondrial abnormalities. (A) Representative confocal images of rat primary neurons co-transfected with eGFP, eGFP-FUSWT, eGFP-FUSR514G or eGFP-FUSΔNLS (green) and Ds-MitoRed (red). Boxes show a region of interest that was used for quantification and magnified underneath. Scale bar = 10 μm. (B,C) Quantitative analysis of the average number and area of mitochondria within each dendritic branch after co-transfection with Ds-MitoRed and WT and mutant FUS. Statistical analysis was performed using a One-Way ANOVA with a post-hoc Tukey’s multiple comparisons test. n = three neurites from five different cells from three independent replicates were analysed for each co-transfection.

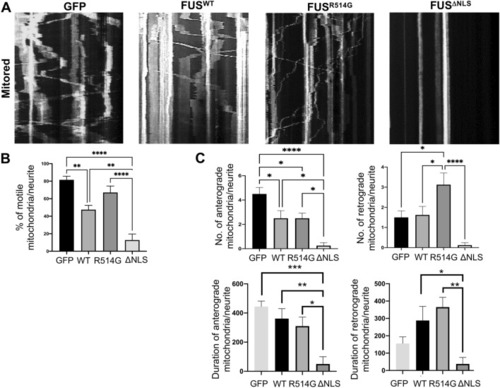
Mitochondrial motility is affected by mutations in FUS. (A) Kymographs showing mitochondrial movement in neurites over a 10 min period. The angle and number of lines indicates the speed, direction and number of mitochondria moving. N = eight neurites from three different independent replicates for each co-transfection. (B) Quantitative analysis of the kymographs showed significant changes to overall mitochondrial movement with eGFP-FUSWT reducing the movement compared to the control (p < 0.01). eGFP-FUSR514G showed an increase whilst there were very few mobile mitochondria in the eGFP-FUSΔNLS expressing neurons (p < 0.01). (C) Analysis of the number and duration of anterograde movement (left hand panels) shows no significant differences between the eGFP-FUSWT and eGFP-FUSR514G though there is a decrease in the average duration of the movement. In contrast there is a significant loss of movement and reduction in the in the eGFP-FUSΔNLS neurons compare to eGFP-FUSWT (p < 0.05 number, p < 0.01 for duration). In contrast there is a significant increase in the retrograde number of mitochondria transported of eGFP-FUSR514G (p < 0.05) and duration of movemement (p < 0.01) compared to eGFP-FUSWT with almost a complete loss of movement in the eGFP-FUSΔNLS transfected cells. Statistical analysis was performed using a One-Way ANOVA with a post-hoc Tukey’s multiple comparisons test. *p < 0.05, **p < 0.01, ***p < 0.001 ****p < 0.0001.

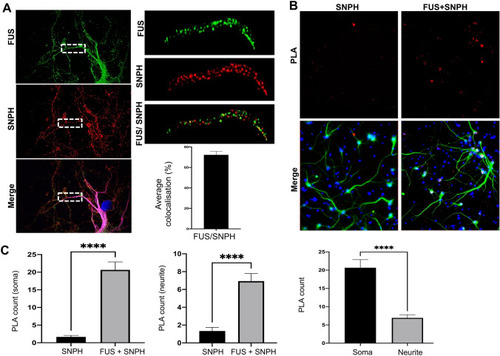
FUS Interacts with the mitochondrial anchor protein, Syntaphillin. (A) Representative super-resolution images of rat primary cortical neurons stained for endogenous FUS (green), Syntaphillin (red) and MAP2 (merge). Quantification of the subcellular localisation showed that FUS and SNPH preferentially localised within neurites (N = three dendrites from ten different neurons). Scale bar = 20 μm. Statistical analysis was performed using a paired student’s T-test; error bars are ± SEM. (B) Representative images of PLA in rat primary neurons. PLA (red) was used to assess interactions within soma and neurites which were determined through MAP2 staining (green). Nuclei were counterstained with DAPI. Scale bar = 100 μm (C) Quantification of PLA interactions within soma and neurite for both SNPH. There was an interaction between FUS-SNPH shown in the soma and neurites whilst there appears to be a stronger interaction with FUS-SNPH in the soma when compared to neurites. N = five cells and three neurites per cell were analysed from three different independent replicates. ****p < 0.0001.

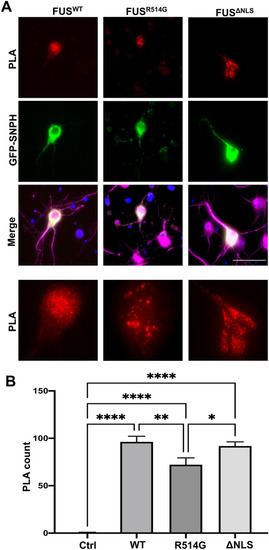
Overexpression of FUS mutations and GFP-SNPH alters FUS-SNPH interactions in transfected neurons. (A) Representative images of primary cortical neurons transfected with HA-FUSWT, HA-FUSR514G or HA-FUSΔNLS (green). eGFP-SNPH is shown for each transfected cell which allowed PLA (red) between HA and eGFP to assess interactions within the cell body for each neuron analysed. Nuclei were counterstained with DAPI. A zoomed in image of the soma for each condition has been provided to show the change in FUS-SNPH interactions, Scale bar = 50 μm (B) Quantification of PLA interactions within soma for HA and eGFP. There is a significant decrease in the FUS-SNPH interaction in HA-FUSR514G transfected cells compared to HA-FUSWT (p < 0.01) and a non-significant decrease in the FUS-SNPH interaction in the HA-FUS ΔNLS compared to HA-FUSWT (p = 0.6277). Statistical analysis was performed using a One-Way ANOVA with a post-hoc Tukey’s multiple comparisons test; error bars are ± SEM. N = five cells were analysed from three different independent replicates. Single antibody controls were performed for the antibody which shows a mainly diffuse pattern. *p < 0.05, **p < 0.01, ***p < 0.001 ****p < 0.0001.

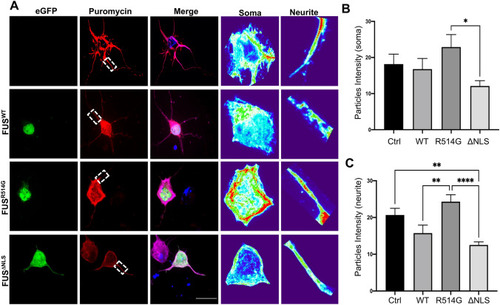
Overexpression of FUS mutations alters protein translation within transfected neurons. (A) Representative images of primary cortical neurons transfected with eGFP-FUSWT, eGFP-FUSR514G or eGFP-FUSΔNLS (green) and stained for puromycin (red) and MAP2 (merge). Zoomed in images of each soma and neurite which were analysed has been included for each condition and presented in a heatmap to show changes more clearly. (B) Quantification of average intensity of puromycin puncta within soma show a non-significant decrease when eGFP-FUSΔNLS is compared to eGFP-FUSWT (p = 0.5704). Comparison of eGFP-FUSWT to control showed no significance (p = 0.2041) whereas comparison of eGFP-FUSWT to eGFP-FUSR514G showed a non-significant increase (p = 0.4042). However, comparison of eGFP-FUSR514G to eGFP-FUSΔNLS showed significant decrease (p < 0.05). (C) Quantification of protein translation in neurites showed a significant increase when eGFP-FUSΔNLS or eGFP-FUSwt was compared to eGFP-FUSR514G (P < 0.0001 and p < 0.01 respectively). Furthermore, a significant decrease was observed when control was compared to both eGFP-FUSΔNLS (P < 0.01) while a non-significant decrease was seen for comparison against and eGFP-FUSwt (p = 0.2041). When eGFP-FUSΔNLS was compared to eGFP-FUSwt, no significant change was observed (P = 0.5704). Statistical analysis was performed using a One-Way ANOVA with a post-hoc Tukey’s multiple comparisons test; error bars are ± SEM. N = five cells were analysed from three different independent replicates. *p < 0.05, **p < 0.01, ***p < 0.001 ****p < 0.0001.

Acknowledgments
This image is the copyrighted work of the attributed author or publisher, and ZFIN has permission only to display this image to its users. Additional permissions should be obtained from the applicable author or publisher of the image. Full text @ Sci. Rep.