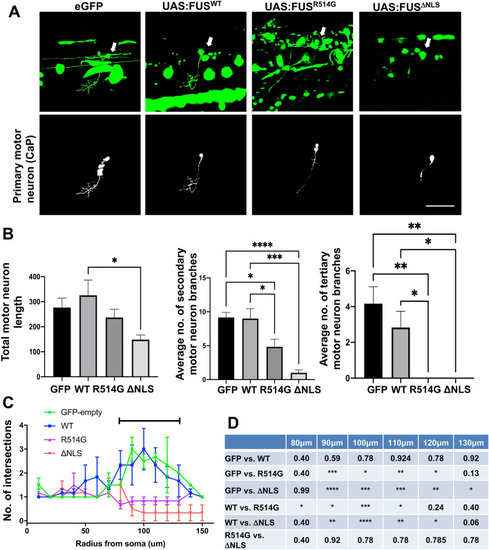
Mutant FUS expression in primary motor neurons affects axonal branching. (A) Confocal images of long pec stage zebrafish trunk microinjected with eGFP, eGFP-FUSWT, eGFP-FUSR514G or eGFP-FUSΔNLS. Images show the lateral view, anterior to the right. Top panels show an isolated GFP expressing motor neuron which are indicated by a white arrow (green) while bottom panels show a traced isolated motor neuron which was used to quantify axonal branching for each condition. Scale bar = 100 μm. (B) Quantitative analysis comparing total average axonal length where GFP-FUS is being expressed between each mutation and control injection (top left) shows a significant reduction in the eGFP-FUSΔNLS expressing length compare to eGFP-FUSWT. Data represent mean axonal length per 100 μm ± SEM. Analysis of the average number of secondary axonal branches (top right) showed a significant decrease in axons expressing eGFP-FUSR514G (p < 0.05) and eGFP-FUSΔNLS (p < 0.001) compared to eGFP-FUSWT. Data represent mean number of secondary axonal branches per 100 μm ± SEM. When analysis was undertaken of the number of tertiary axonal branches (bottom), it was clear that whilst numbers were low, there were no tertiary branches in axons expressing eGFP-FUSR514G or eGFP-FUSΔNLS. Data represent mean number of tertiary axonal branches per 100 μm ± SEM was also compared between conditions. (C,D) Quantitative analysis of axonal branching after microinjection of eGFP-FUSWT and mutant FUS in primary motor axons. Sholl analysis revealed a significant change between 80–130 μm away from the soma when assessing how axonal branching was affected by eGFP-FUSWT or mutant FUS. Statistical analysis was performed using a two-Way ANOVA with a multiple comparisons test which compared the simple effects within each row; error bars are ± SEM. Significant results (represented by bar in C) are presented in the table (D). N = six different independent injections for each plasmid.
|
