IMAGE

Figure 5

ID
ZDB-IMAGE-210708-66
Source
Figures for Salam et al., 2021
Image
Figure Caption

Figure 5

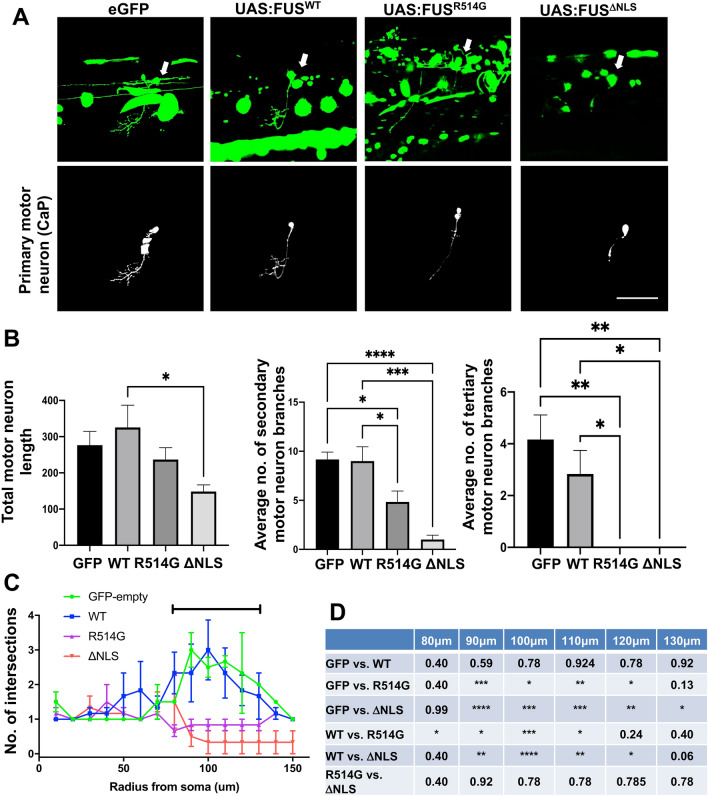
Mutant FUS expression in primary motor neurons affects axonal branching. (A) Confocal images of long pec stage zebrafish trunk microinjected with eGFP, eGFP-FUSWT, eGFP-FUSR514G or eGFP-FUSΔNLS. Images show the lateral view, anterior to the right. Top panels show an isolated GFP expressing motor neuron which are indicated by a white arrow (green) while bottom panels show a traced isolated motor neuron which was used to quantify axonal branching for each condition. Scale bar = 100 μm. (B) Quantitative analysis comparing total average axonal length where GFP-FUS is being expressed between each mutation and control injection (top left) shows a significant reduction in the eGFP-FUSΔNLS expressing length compare to eGFP-FUSWT. Data represent mean axonal length per 100 μm ± SEM. Analysis of the average number of secondary axonal branches (top right) showed a significant decrease in axons expressing eGFP-FUSR514G (p < 0.05) and eGFP-FUSΔNLS (p < 0.001) compared to eGFP-FUSWT. Data represent mean number of secondary axonal branches per 100 μm ± SEM. When analysis was undertaken of the number of tertiary axonal branches (bottom), it was clear that whilst numbers were low, there were no tertiary branches in axons expressing eGFP-FUSR514G or eGFP-FUSΔNLS. Data represent mean number of tertiary axonal branches per 100 μm ± SEM was also compared between conditions. (C,D) Quantitative analysis of axonal branching after microinjection of eGFP-FUSWT and mutant FUS in primary motor axons. Sholl analysis revealed a significant change between 80–130 μm away from the soma when assessing how axonal branching was affected by eGFP-FUSWT or mutant FUS. Statistical analysis was performed using a two-Way ANOVA with a multiple comparisons test which compared the simple effects within each row; error bars are ± SEM. Significant results (represented by bar in C) are presented in the table (D). N = six different independent injections for each plasmid.

Acknowledgments
This image is the copyrighted work of the attributed author or publisher, and ZFIN has permission only to display this image to its users. Additional permissions should be obtained from the applicable author or publisher of the image. Full text @ Sci. Rep.