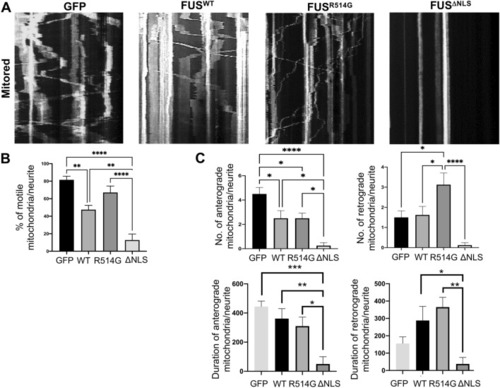
Mitochondrial motility is affected by mutations in FUS. (A) Kymographs showing mitochondrial movement in neurites over a 10 min period. The angle and number of lines indicates the speed, direction and number of mitochondria moving. N = eight neurites from three different independent replicates for each co-transfection. (B) Quantitative analysis of the kymographs showed significant changes to overall mitochondrial movement with eGFP-FUSWT reducing the movement compared to the control (p < 0.01). eGFP-FUSR514G showed an increase whilst there were very few mobile mitochondria in the eGFP-FUSΔNLS expressing neurons (p < 0.01). (C) Analysis of the number and duration of anterograde movement (left hand panels) shows no significant differences between the eGFP-FUSWT and eGFP-FUSR514G though there is a decrease in the average duration of the movement. In contrast there is a significant loss of movement and reduction in the in the eGFP-FUSΔNLS neurons compare to eGFP-FUSWT (p < 0.05 number, p < 0.01 for duration). In contrast there is a significant increase in the retrograde number of mitochondria transported of eGFP-FUSR514G (p < 0.05) and duration of movemement (p < 0.01) compared to eGFP-FUSWT with almost a complete loss of movement in the eGFP-FUSΔNLS transfected cells. Statistical analysis was performed using a One-Way ANOVA with a post-hoc Tukey’s multiple comparisons test. *p < 0.05, **p < 0.01, ***p < 0.001 ****p < 0.0001.
|
