IMAGE

Figure 7

ID
ZDB-IMAGE-210708-67
Source
Figures for Salam et al., 2021
Image
Figure Caption

Figure 7

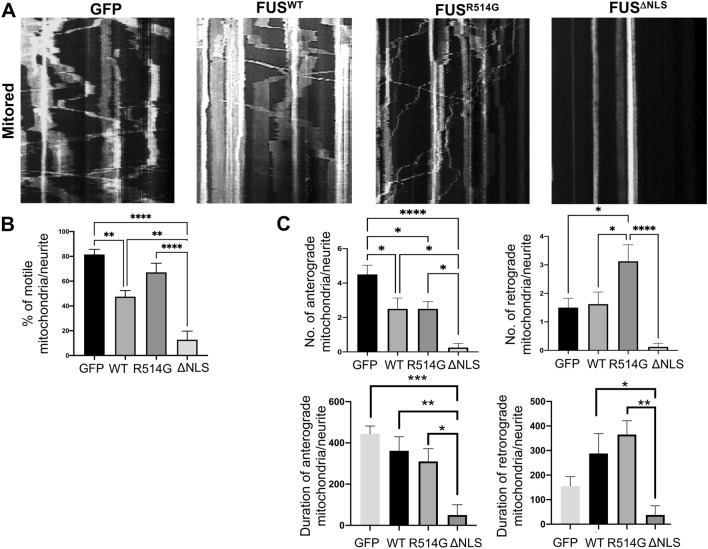
Mitochondrial motility is affected by mutations in FUS. (A) Kymographs showing mitochondrial movement in neurites over a 10 min period. The angle and number of lines indicates the speed, direction and number of mitochondria moving. N = eight neurites from three different independent replicates for each co-transfection. (B) Quantitative analysis of the kymographs showed significant changes to overall mitochondrial movement with eGFP-FUSWT reducing the movement compared to the control (p < 0.01). eGFP-FUSR514G showed an increase whilst there were very few mobile mitochondria in the eGFP-FUSΔNLS expressing neurons (p < 0.01). (C) Analysis of the number and duration of anterograde movement (left hand panels) shows no significant differences between the eGFP-FUSWT and eGFP-FUSR514G though there is a decrease in the average duration of the movement. In contrast there is a significant loss of movement and reduction in the in the eGFP-FUSΔNLS neurons compare to eGFP-FUSWT (p < 0.05 number, p < 0.01 for duration). In contrast there is a significant increase in the retrograde number of mitochondria transported of eGFP-FUSR514G (p < 0.05) and duration of movemement (p < 0.01) compared to eGFP-FUSWT with almost a complete loss of movement in the eGFP-FUSΔNLS transfected cells. Statistical analysis was performed using a One-Way ANOVA with a post-hoc Tukey’s multiple comparisons test. *p < 0.05, **p < 0.01, ***p < 0.001 ****p < 0.0001.

Acknowledgments
This image is the copyrighted work of the attributed author or publisher, and ZFIN has permission only to display this image to its users. Additional permissions should be obtained from the applicable author or publisher of the image. Full text @ Sci. Rep.