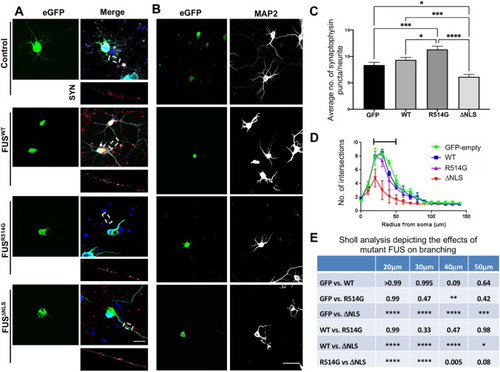
ALS-linked mutations in FUS lead to pre-synaptic alterations. (A) Representative confocal images of DIV8 rat primary cortical neurons transfected with eGFP, eGFP-FUSWT, eGFP-FUSR514G or eGFP-FUSΔNLS (green) and stained for synaptophysin (red) and MAP2 (merge). Overexpressed mutant FUS leads to differing levels of cytoplasmic mislocalisation for both eGFP-FUSR514G and eGFP-FUSΔNLS. Smaller images below show a representative region of interest used for quantification. Nuclei were counterstained with DAPI. Scale bar = 10 μm. (B) Representative confocal images showing mutation specific changes to dendritic branching. Left panels show eGFP expression (green), right panels show MAP2 staining (greyscale). Scale bar = 100 μm. (C) Quantitative analysis comparing the number of pre-synaptic puncta between each mutation and control. There is a significant increase in the number of SYN puncta in the neurons transfected with eGFP-FUSR514G compared to eGFP-FUSWT (p < 0.05) and a significant decrease in puncta in neurites expressing eGFP-FUSΔNLS (p < 0.0001). Statistical analysis was performed using a One-Way ANOVA with a post-hoc Tukey’s multiple comparisons test; error bars are ± SEM (n = three neurites from five cells per condition, three independent replicates). Data represent mean synaptophysin puncta on each dendrite per 10 μm ± SEM. (D,E) Sholl analysis revealed a significant change in branching between 20–50 μm away from the soma with the eGFP-FUS compared to all other conditions (n = ten transfected cells from three individual replicates). Statistical analysis was performed using a two-Way ANOVA with a multiple comparisons test which compared the simple effects within each row; error bars are ± SEM. Significant results are represented by the black bar and presented in the table (E). *p < 0.05, **p < 0.01, ***p < 0.001 ****p < 0.0001.
|
