FIGURE

Figure 4

ID
ZDB-FIG-210708-60
Publication
Salam et al., 2021 - Identification of a novel interaction of FUS and syntaphilin may explain synaptic and mitochondrial abnormalities caused by ALS mutations
Other Figures
All Figure Page
Back to All Figure Page
Figure 4

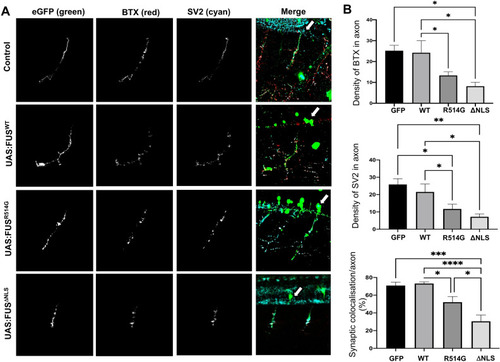
Zebrafish expressing mutant FUS show abnormal neuromuscular junctions and orphaned pre-synaptic endings. (A) Confocal images of long pec stage zebrafish trunk, lateral view, anterior to the right, imaged after microinjection with eGFP, eGFP-FUSWT, eGFP-FUSR514G or eGFP-FUSΔNLS. Merged images show the GFP-FUS (green) and SV2 (cyan) and BTX staining (red) which is indicated by a white arrow for each condition. Analysis was carried out on the greyscale images. Scale bar = 100 μm. (B) Quantitative analysis of the synaptic density of BTX, SV2 and synaptic colocalization. There was a significant reduction in the number of NMJs as shown by a reduction in both BTX (top) and SV2 (middle) staining in axons expressing eGFP-FUSR514G (p < 0.05) and eGFP-FUSΔNLS (p < 0.05) compared to eGFP-FUSWT. The colocalisation between the SV2 and the BTX (bottom) was also reduced in axons expressing eGFP-FUSR514G (p < 0.05) and eGFP-FUSΔNLS (p < 0.0001) compared to WT. Statistical analysis was performed using a One-Way ANOVA with a post-hoc Tukey’s multiple comparisons test; error bars are ± SEM. N = six different independent injections for each plasmid. *p < 0.05, **p < 0.01, ***p < 0.001 ****p < 0.0001.

Expression Data

Expression Detail
Antibody Labeling
Phenotype Data

Phenotype Detail
Acknowledgments
This image is the copyrighted work of the attributed author or publisher, and ZFIN has permission only to display this image to its users. Additional permissions should be obtained from the applicable author or publisher of the image. Full text @ Sci. Rep.