IMAGE

Figure 6

ID
ZDB-IMAGE-210708-61
Source
Figures for Salam et al., 2021
Image
Figure Caption

Figure 6

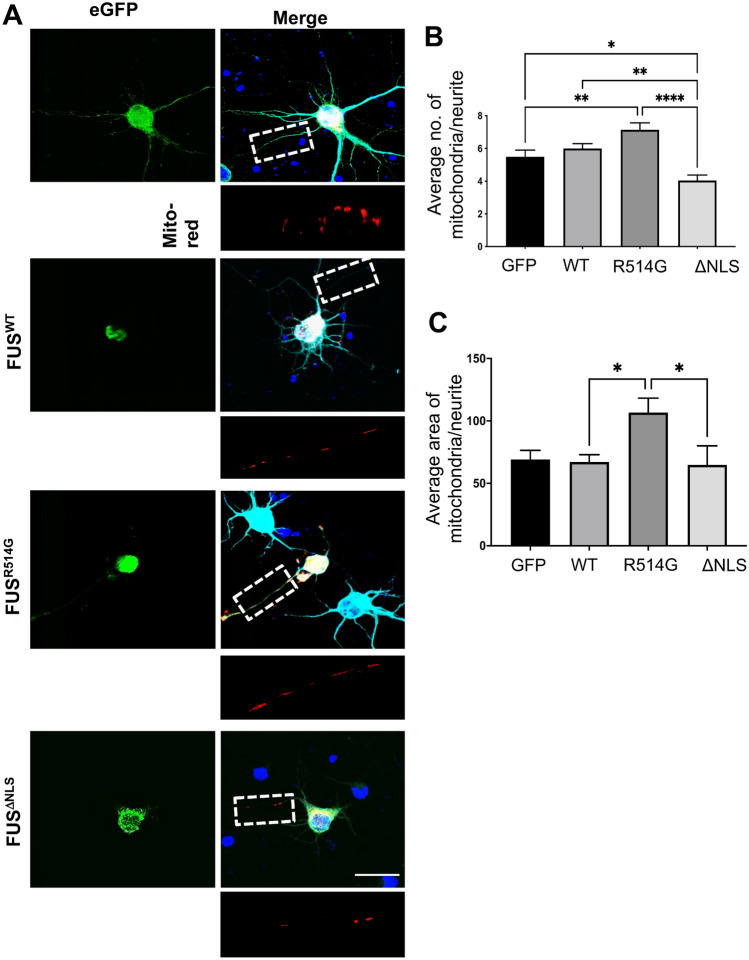
Expression of mutant FUS leads to mitochondrial abnormalities. (A) Representative confocal images of rat primary neurons co-transfected with eGFP, eGFP-FUSWT, eGFP-FUSR514G or eGFP-FUSΔNLS (green) and Ds-MitoRed (red). Boxes show a region of interest that was used for quantification and magnified underneath. Scale bar = 10 μm. (B,C) Quantitative analysis of the average number and area of mitochondria within each dendritic branch after co-transfection with Ds-MitoRed and WT and mutant FUS. Statistical analysis was performed using a One-Way ANOVA with a post-hoc Tukey’s multiple comparisons test. n = three neurites from five different cells from three independent replicates were analysed for each co-transfection.

Acknowledgments
This image is the copyrighted work of the attributed author or publisher, and ZFIN has permission only to display this image to its users. Additional permissions should be obtained from the applicable author or publisher of the image. Full text @ Sci. Rep.