IMAGE

Figure 10

ID
ZDB-IMAGE-210708-70
Source
Figures for Salam et al., 2021
Image
Figure Caption

Figure 10

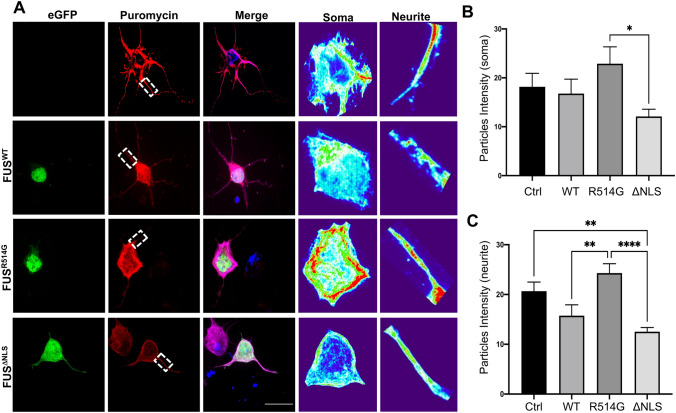
Overexpression of FUS mutations alters protein translation within transfected neurons. (A) Representative images of primary cortical neurons transfected with eGFP-FUSWT, eGFP-FUSR514G or eGFP-FUSΔNLS (green) and stained for puromycin (red) and MAP2 (merge). Zoomed in images of each soma and neurite which were analysed has been included for each condition and presented in a heatmap to show changes more clearly. (B) Quantification of average intensity of puromycin puncta within soma show a non-significant decrease when eGFP-FUSΔNLS is compared to eGFP-FUSWT (p = 0.5704). Comparison of eGFP-FUSWT to control showed no significance (p = 0.2041) whereas comparison of eGFP-FUSWT to eGFP-FUSR514G showed a non-significant increase (p = 0.4042). However, comparison of eGFP-FUSR514G to eGFP-FUSΔNLS showed significant decrease (p < 0.05). (C) Quantification of protein translation in neurites showed a significant increase when eGFP-FUSΔNLS or eGFP-FUSwt was compared to eGFP-FUSR514G (P < 0.0001 and p < 0.01 respectively). Furthermore, a significant decrease was observed when control was compared to both eGFP-FUSΔNLS (P < 0.01) while a non-significant decrease was seen for comparison against and eGFP-FUSwt (p = 0.2041). When eGFP-FUSΔNLS was compared to eGFP-FUSwt, no significant change was observed (P = 0.5704). Statistical analysis was performed using a One-Way ANOVA with a post-hoc Tukey’s multiple comparisons test; error bars are ± SEM. N = five cells were analysed from three different independent replicates. *p < 0.05, **p < 0.01, ***p < 0.001 ****p < 0.0001.

Acknowledgments
This image is the copyrighted work of the attributed author or publisher, and ZFIN has permission only to display this image to its users. Additional permissions should be obtained from the applicable author or publisher of the image. Full text @ Sci. Rep.