
- Title
-
Temporal characterization of optic fissure basement membrane composition suggests nidogen may be an initial target of remodeling
- Authors
- Nicholas, C., Weaver, M., Piedade, W.P., Vocking, O., Famulski, J.K.
- Source
- Full text @ Dev. Biol.
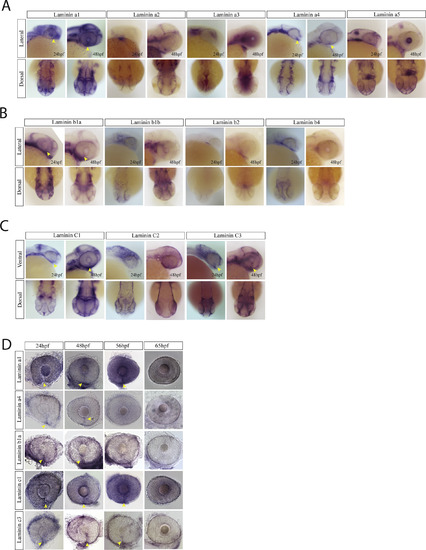
Laminin expression during optic fissure formation and fusion. A) WISH for zebrafish laminin alpha chain genes a1, a2, a3, a4 and a5. Expression was analyzed at 24 and 48hpf and visualized in lateral and dorsal views. At 24 and 48hpf laminins a1, a4 and a5 were observed to express within the optic fissure (yellow arrow heads). Laminin a2 and a3 were largely absent from the retina while laminin a5 was expressed in the developing lens at 48hpf. B) WISH for laminin beta chain genes b1, b2 and b3 at 24 and 48hpf. Only laminin 1b was found to be expressed in the optic fissure (yellow arrow heads). Laminin b2 and b3 were largely absent from the retina. C) WISH for laminin genes c1, c2 and c3 at 24 and 48hpf. Laminin c1 and c3 were detected in the optic fissure (yellow arrow heads) while c2 appears to primarily be expressed in the ectoderm. D) WISH time course examination of laminin gene expression in the optic fissure. Laminin a4 and b1 are expressed in the fissure up to 48hpf, while a1, c1 and c3 retain expression up to 56hpf (yellow arrow heads). |
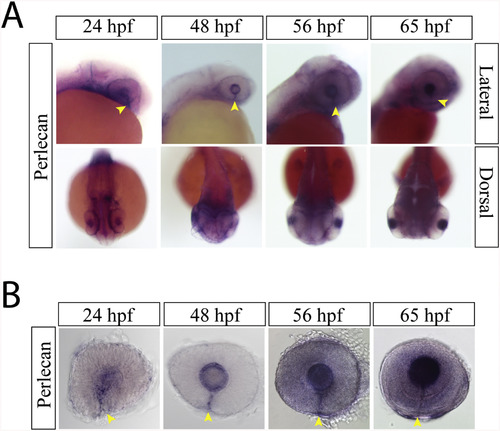
Perlecan expression during optic fissure formation and fusion. A) WISH for zebrafish perlecan at 24, 48, 56 and 65hpf. Perlecan expression is observed in the lens and the optic fissure from 24 to 65 hpf (yellow arrow heads). B) Examining WISH in isolated zebrafish eyes at 24, 48, 56 and 65hpf indicates that perlecan expression persists in the optic fissure (yellow arrow heads) up to 65hpf. |
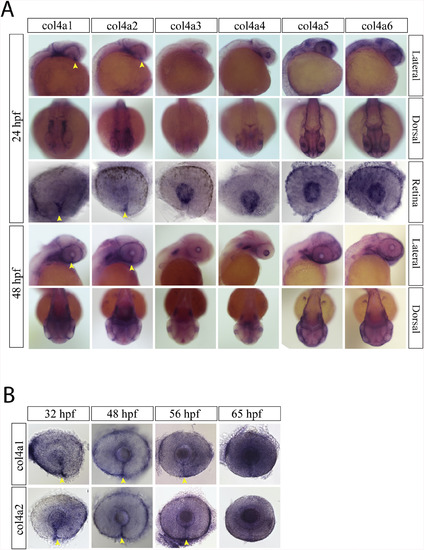
Collagen IV expression during optic fissure formation and fusion. A) WISH for zebrafish collagen IV (col4) genes a1-a6 at 24hpf. At 24hpf, only collagen IV a1 and a2 had optic fissure expression (yellow arrow heads). Col4 a3-a6 were all detected in the retinal periphery and in the developing lens. B) WISH time course for col4 a1 and a2 expression from 24 to 65hpf. Both col4 a1 and a2 had detectable expression in the optic fissure up to 56hpf (yellow arrow heads). |
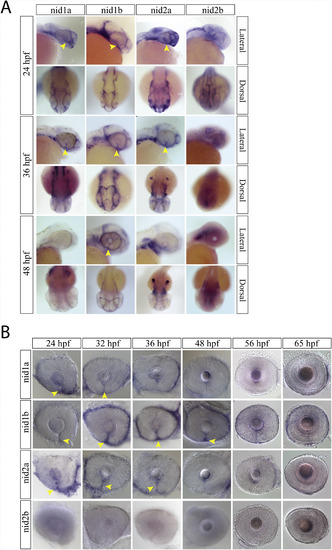
Nidogen expression during optic fissure formation and fusion. A) WISH for zebrafish nidogen (nid) genes nid1a, nid1b, nid2a and nid2b at 24, 36 and 48hpf. At 24 and 36hpf nid1a, nid1b and nid2a were all expressed in the optic fissure (yellow arrow heads). Nid2b lack retinal expression between 24 and 48hpf. B) WISH time course for nid1a, 1b and 2a expression in the optic fissure (yellow arrow heads). Expression of nid1a and 2a is absent from the fissure by 48hpf, while nid1b persists past 48hpf but is absent by 56hpf. |
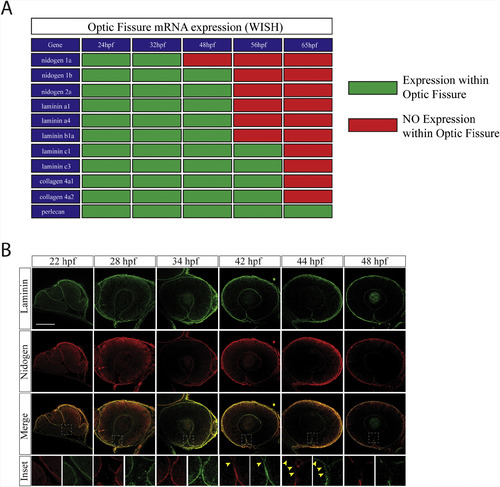
Nidogen is down-regulated prior to laminin during optic fissure fusion. A) Summary of core basement membrane component expression within the optic fissure as observed by WISH (Fig. 1, Fig. 2, Fig. 3, Fig. 4) between 24 and 65hpf. Green indicates expression (WISH signal), red indicates absence of expression (lack of WISH signal). B)Immunohistochemistry analysis for remodeling of laminin (green) and nidogen 1 (red) within the optic fissure during retinal morphogenesis(22-48hpf). At early time points, ∼22-40hpf, laminin and nidogen signal is found to co-localize in the optic fissure BM. Starting at 42hpf nidogen signal in the optic fissure is reduced prior to that of laminin (yellow arrow heads). By 48hpf both laminin and nidogen are absent in the regions of the fissure where fusion has completed. Scale bar = 50 μm. EXPRESSION / LABELING:
|
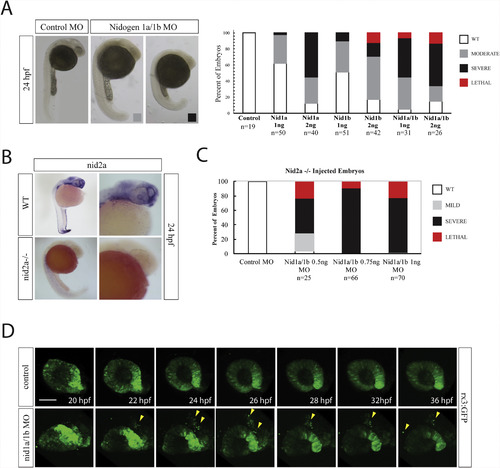
Nidogen is required during retinal development. A) Nidogen 1a and 1b morpholino injection phenotypes at various concentrations and combinations. Moderate phenotypes (gray bar) included potential developmental delays but lacked overt morphological deficiencies. Severe phenotypes (black bar) included significant developmental delays and morphological deficiencies. Lethal phenotypes (red bar) included monster embryos and major developmental deficiencies. B)WISH for nid2a comparing expression in WT and nid2asa15280 −/− embryos at 24hpf. Nid2a signal is completely absent in nid2asa15280 −/− embryos. C) Nidogen 1a and 1b morpholino injections into nid2asa15280−/− embryos. Sub-effective doses of nid1a and nid1b MOs, 0.5 or 0.75 ng each, resulted in up to 80% of embryos exhibiting severe or lethal phenotypes. At 1 ng the injections resulted in exclusively severe or lethal phenotypes. D) In vivo real time imaging of rx3:GFP embryos co-injected with nid1a and nid1b morpholinos. 3D stacks were collected every 10min for 16 h. Compared to control, nid1 morphantsdisplay a disorganized optic cup, a significant delay in the formation of opposing retinal lobes, an elongation of the N/T axis and delamination of retinal progenitor cells (yellow arrowheads). Scale bar = 50 μm. EXPRESSION / LABELING:
PHENOTYPE:
|
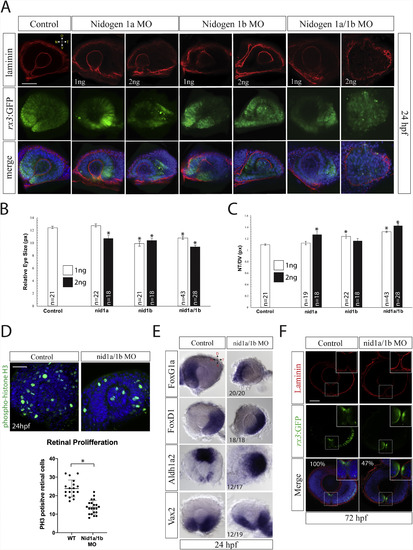
Nidogen is essential for accurate retinal morphogenesis. A)Retinal phenotypes in 24hpf nid1 morphant rx3:GFP (green) expressing embryos were characterized using laminin IHC (red), and DAPI (blue). Representative single confocal sections are depicted. Retinal shape is moderately disrupted at low morpholinoconcentrations (1 ng) with most severe effects observed in double morphant embryos (2 ng). Laminin deposition appears to be mildly affected upon co-injection of nid1a and 1b MO at 2 ng 40–50 embryos were examined for each treatment. Scale bar = 50 μm. B) Quantification of relative retinal size observed in 24hpf morphant embryos. Significantly smaller eyes were observed upon injection of either nid1a or nid1b morpholinos, with the smallest resulting from co-injection of nid1a and 1b morpholinos. Student T-tests were conducted between control and all treatment groups for each parameter measured. * = p < .005. C) Quantification of retinal shape in 24hpf nidogen morphant embryos. Injection of nid1a or nid1b results in an extended NT axis, with co-injection having a synergistic effect. Student T-tests were conducted between control and all treatment groups for each parameter measured. * = p < .05. D) Phospho-histoneH3 (PH3) staining (green) at 24hpf in control and nid1a/1b co-injected embryos. 3D reconstructions are displayed. PH3+ cell counts from individual embryos analyzed are graphed. DAPI is shown in blue. WT n = 19, Nid1a/1b MO n = 23. *p = .0001, Student T-test. Scale bar = 50 μm. E)WISH for temporal, foxG1a, nasal, foxD1, ventral, vax2 and dorsal, aldh1a2 in nid1a/nid1b morphant retinas at 24hpf. WT and morphant embryo eyes were dissected, mounted and imaged. Nid1a/1b morphant eyes show no significant effects on nasal/temporal patterning, while ventral domains appear shifted temporally and dorsal regions expanded. F) Examination of optic fissure fusion at 72hpf via laminin (red) IHC in rx3:GFP (green) expressing morphant embryos. Inset (dashed square) displays high magnification of the optic fissure. Single confocal planes of the central-distal region of the fissure are depicted. Results reveal the persistence of laminin signal in 47% (n = 41 control, n = 27 nid1a/1b MO, p = .0001) of 72hpf morphant fissures, a time when control embryos have already completed fusion and removed laminin. Scale bar = 50 μm. EXPRESSION / LABELING:
PHENOTYPE:
|
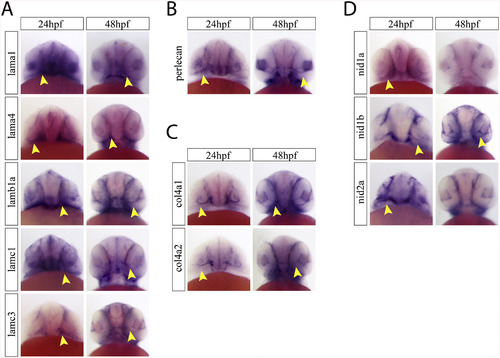
Ventral examination of optic fissure expression of core basement membrane components. A) Ventral images of embryos after WISH for laminin a1, a4, b1a, c1 and c3 at 24 and 48hpf. Yellow arrow heads indicate optic fissure expression. B) Ventral images of embryos after WISH for perlecan at 24 and 48hpf. Yellow arrow heads indicate optic fissure expression. C) Ventral images of embryos after WISH for col4a1 and col4a2 at 24 and 48hpf. Yellow arrow heads indicate optic fissure expression. D) Ventral images of embryos after WISH for nidogen 1a, 1b and 2a at 24 and 48hpf. Yellow arrow heads indicate optic fissure expression. |
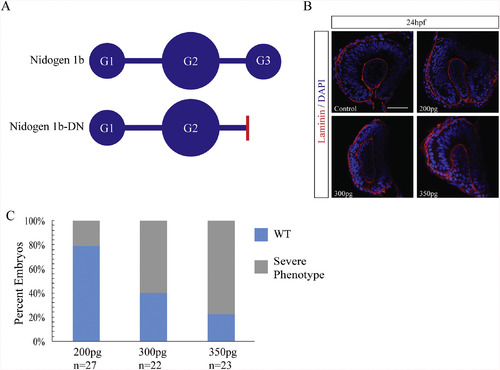
Nidogen dominant negative mRNA injections result in ocular malformation. A) Schematic diagram of nidogen functional domains and the strategy for generating a dominant negative nidogen construct by truncating nidogen 1b of the G3 domain. Red bar indicates deletion point of globular domain 3 in nid1b-DN. B) Retinal phenotypes in 24hpf nid1b-DN mRNA injected embryos characterized using laminin IHC (red), and DAPI (blue). Single confocal sections are depicted. Scale bar = 50 μm. C) Increasing concentration of nid1b-DN mRNA resulted in higher percentage of ocular morphological defects observed at 24hpf. |
Reprinted from Developmental Biology, 452(1), Nicholas, C., Weaver, M., Piedade, W.P., Vocking, O., Famulski, J.K., Temporal characterization of optic fissure basement membrane composition suggests nidogen may be an initial target of remodeling, 43-54, Copyright (2019) with permission from Elsevier. Full text @ Dev. Biol.