
Fig. S1
- ID
- ZDB-IMAGE-191007-16
- Genes
- Publication
- Nicholas et al., 2019 - Temporal characterization of optic fissure basement membrane composition suggests nidogen may be an initial target of remodeling
- All Figures
- Figures for Nicholas et al., 2019
|
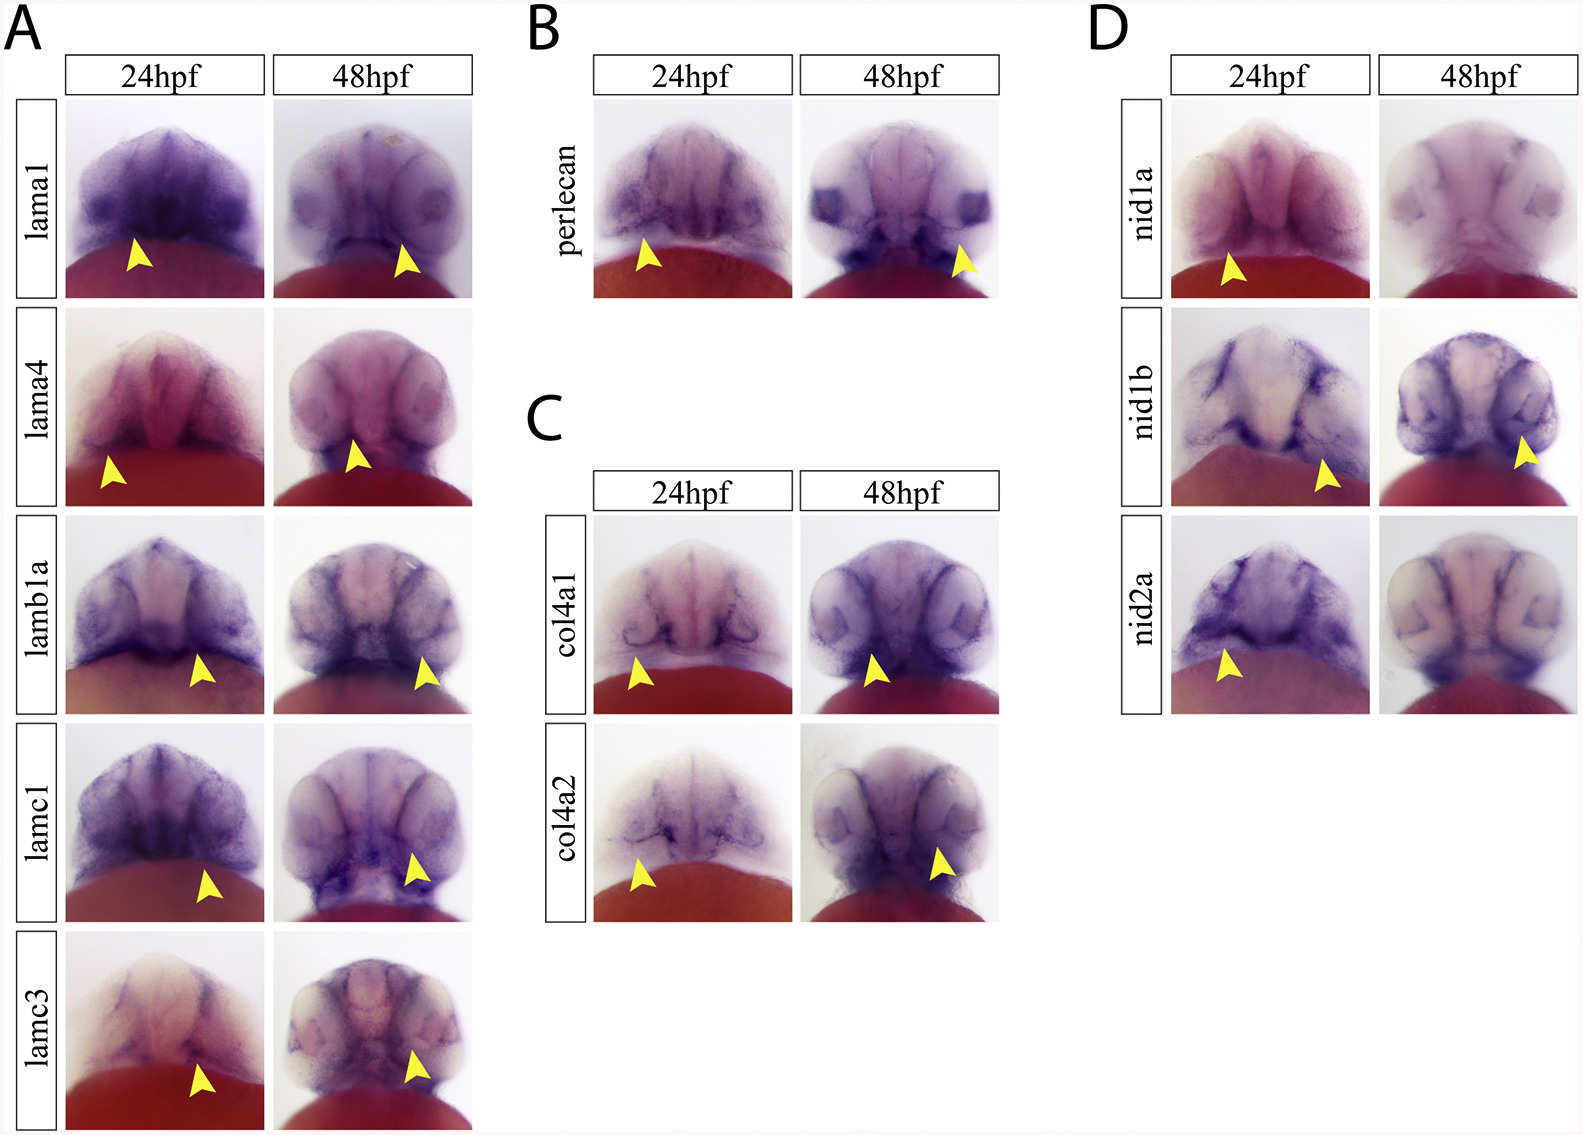
Fig. S1
Ventral examination of optic fissure expression of core basement membrane components. A) Ventral images of embryos after WISH for laminin a1, a4, b1a, c1 and c3 at 24 and 48hpf. Yellow arrow heads indicate optic fissure expression. B) Ventral images of embryos after WISH for perlecan at 24 and 48hpf. Yellow arrow heads indicate optic fissure expression. C) Ventral images of embryos after WISH for col4a1 and col4a2 at 24 and 48hpf. Yellow arrow heads indicate optic fissure expression. D) Ventral images of embryos after WISH for nidogen 1a, 1b and 2a at 24 and 48hpf. Yellow arrow heads indicate optic fissure expression.
Reprinted from Developmental Biology, 452(1), Nicholas, C., Weaver, M., Piedade, W.P., Vocking, O., Famulski, J.K., Temporal characterization of optic fissure basement membrane composition suggests nidogen may be an initial target of remodeling, 43-54, Copyright (2019) with permission from Elsevier. Full text @ Dev. Biol.