
- Title
-
Hif-1α regulates macrophage-endothelial interactions during blood vessel development in zebrafish
- Authors
- Gerri, C., Marín-Juez, R., Marass, M., Marks, A., Maischein, H.M., Stainier, D.Y.R.
- Source
- Full text @ Nat. Commun.
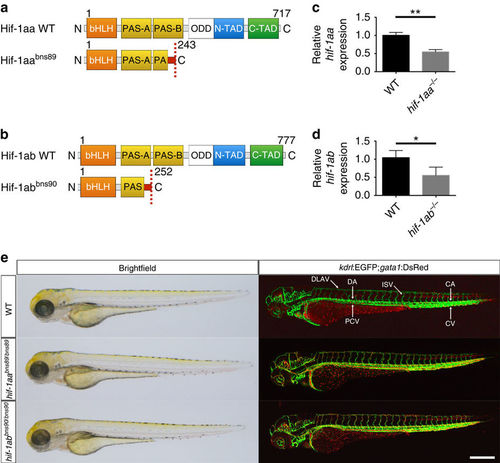
Absence of obvious morphological or vascular defects in hif-1aa and hif-1ab single mutants. (a,b) Schematic representation of the following proteins: WT and mutant (bns89 allele) Hif-1aa, WT and mutant (bns90 allele) Hif-1ab. bHLH, basic helix-loop-helix domain; PAS-A/B, PAS domains; ODD, oxygen degradation dependent domain; N-TAD, N-terminal transactivation domain; C-TAD, C-terminal transactivation domain. Red box before the stop codon represents missense sequence. (c) qPCR analysis of hif-1aa expression in WT siblings and hif-1aabns89 mutants at 48 hpf. (d) qPCR analysis of hif-1ab expression in WT siblings and hif-1abbns90 mutants at 48 hpf. Values represent mean±s.d., n=3 biological replicates, (*P<0.05; **P<0.01; t-test). (e) Representative brightfield images and maximal intensity projections of confocal z-stacks of Tg(kdrl:EGFP);Tg(gata1:DsRed) WT siblings and hif-1aa and hif-1ab mutants at 72 hpf; lateral views. n=3 clutches. CA, caudal artery; CV, caudal vein; DA, dorsal aorta; DLAV, dorsal longitudinal anastomotic vessel; ISV, intersegmental vessel; PCV, posterior cardinal vein. Scale bar, 200 μm. EXPRESSION / LABELING:
PHENOTYPE:
|
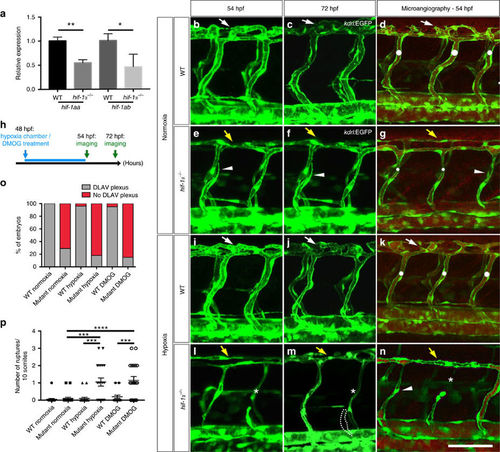
hif-1α mutants fail to form the DLAV plexus and exhibit hypoxia-induced vascular disconnections. (a) qPCR analysis of hif-1aa and hif-1ab transcripts in WT siblings and hif-1α mutants at 48 hpf. Values represent mean±s.d., n = 3 biological replicates, (*P<0.05; **P<0.01; t-test). (b–g) Maximal intensity projections of confocal z-stacks of Tg(kdrl:EGFP) WT siblings and hif-1α−/− embryos in normoxia at 54 and 72 hpf, as well as after microangiography at 54 hpf. (h) Schematic representation of the experiment shown in i–p. (i–n) Maximal intensity projections of confocal z-stacks of Tg(kdrl:EGFP) WT siblings and hif-1α−/− embryos after hypoxia chamber treatment for 6 h at 54 and 72 hpf, along with microangiography at 54 hpf. All images represent lateral views. White dots indicate approximate lumen size, white arrows point to DLAV plexus in WT, yellow arrows indicate absence of DLAV plexus in hif-1α−/−, arrowheads point to non-perfused ISVs, asterisks indicate vessel ruptures and dotted lines outline regressed blood vessel. (o) Quantification of embryos showing normal (grey) or abnormal/absent (red) DLAV plexus formation in 54 hpf WT siblings and hif-1α−/− in normoxia, and after hypoxia chamber or DMOG treatment for 6 h starting at 48 hpf. (p) Quantification of blood vessel ruptures in a 10 somite-long trunk area in 54 hpf WT siblings and hif-1α−/−in normoxia, and after hypoxia chamber or DMOG treatment for 6 h starting at 48 hpf. Bars represent mean±s.e.m., n=20 embryos from three different clutches, (***P<0.001; ****P<0.0001; t-test). Scale bar, 50 μm. EXPRESSION / LABELING:
PHENOTYPE:
|
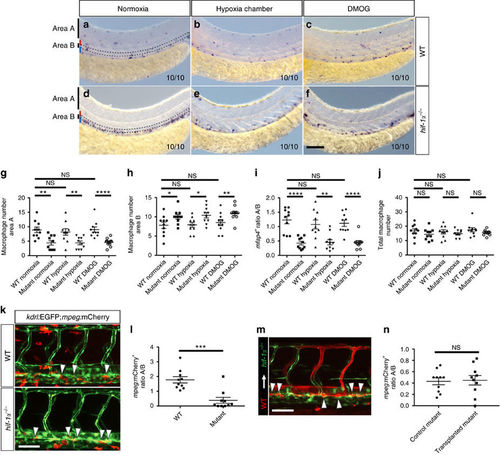
hif-1α is required for macrophage mobilization from the AGM region. (a–f) Brightfield images of WISH for mfap4 expression in 54 hpf WT siblings and hif-1α−/− in normoxia, and after hypoxia chamber or DMOG treatment for 6 h starting at 48 hpf; lateral views. Area A is situated outside the AGM region and area B represents the AGM region (outlined). Red bar marks approximate size of the dorsal aorta and blue bar that of the posterior cardinal vein. n=10 embryos from three different clutches. Scale bar, 100 μm. (g–j) Quantification of macrophage mobilization from the AGM based on mfap4 WISH experiments, showing the macrophage absolute number in area A, macrophage absolute number in area B, ratio of macrophage number in area A to macrophage number in area B and total macrophage number. (k) Maximal intensity projections of confocal z-stacks of Tg(kdrl:EGFP);Tg(mpeg:mCherry) WT and hif-1α−/−embryos at 54 hpf. (l) Quantification of macrophage mobilization from the AGM of 54 hpf Tg(kdrl:EGFP);Tg(mpeg:mCherry) WT siblings and hif-1α−/−embryos. (m) Mosaic vessels from transplantation of WT Tg(kdrl:ras-mCherry) donor cells into hif-1α−/− Tg(kdrl:EGFP) host blastulae. (n) Quantification of macrophage mobilization from the AGM in control Tg(kdrl:EGFP);Tg(mpeg:mCherry) hif-1α−/−and WT EC-transplanted hif-1α−/−embryos at 54 hpf. Arrowheads point to macrophages in the AGM. Bars represent mean±s.e.m., n=10 embryos from three different clutches (*P<0.05; **P<0.01; ***P<0.001; ****P<0.0001; NS, no significant changes observed; t-test). Scale bars, 50 μm. |
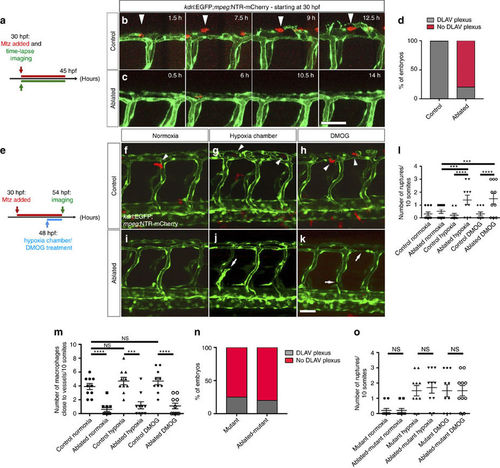
Macrophage ablation leads to the absence of DLAV plexus formation as well as hypoxia-induced vascular disconnections. (a) Schematic representation of the experiment shown in b–d. (b,c) Maximal intensity projections of time-lapse confocal images of control Tg(kdrl:EGFP);Tg(mpeg:NTR-mCherry) and macrophage-ablated embryos in normoxia starting at 30 hpf. Arrowheads point to a macrophage co-localizing with EC sprouts. (d) Quantification of embryos showing normal (grey) or abnormal/absent (red) DLAV plexus formation in 54 hpf control and macrophage-ablated embryos. (e) Schematic representation of the experiment shown in f–m. (f–k) Maximal intensity projections of confocal z-stacks of 54 hpf control Tg(kdrl:EGFP);Tg(mpeg:NTR-mCherry) and macrophage-ablated embryos in normoxia, after hypoxia chamber or DMOG treatment for 6 h starting at 48 hpf. All images represent lateral views. Arrowheads point to macrophages in proximity to blood vessels, and arrows to vessel ruptures. (l) Quantification of blood vessel ruptures in a 10 somite-long trunk area in 54 hpf control and macrophage-ablated embryos in normoxia, after hypoxia chamber or DMOG treatment for 6 h starting at 48 hpf. (m) Quantification of macrophages in proximity to blood vessels in a 10 somite-long trunk area in 54 hpf control and macrophage-ablated embryos in normoxia, after hypoxia chamber or DMOG treatment for 6 h starting at 48 hpf. n=10 embryos for each condition. (n) Quantification of embryos showing normal (grey) or abnormal/absent (red) DLAV plexus formation in 54 hpf control and macrophage-ablated hif-1α−/−embryos. (o) Quantification of blood vessel ruptures in a 10 somite-long trunk area in 54 hpf control and macrophage-ablated hif-1α−/−embryos in normoxia, after hypoxia chamber or DMOG treatment for 6 h starting at 48 hpf. Bars represent mean±s.e.m., n=10 embryos from three different clutches, (***P<0.001; ****P<0.0001; NS, no significant changes observed; t-test). Scale bars, 50 μm. EXPRESSION / LABELING:
|
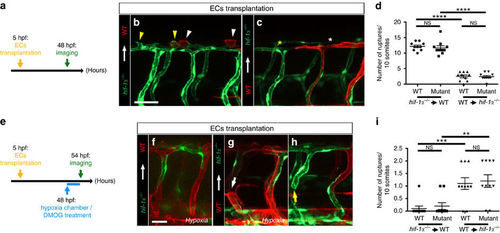
hif-1α does not play a cell-autonomous role in ECs during DLAV plexus formation or during blood vessel repair after hypoxia. (a) Schematic representation of the experiment shown in b–d. (b,c) Transplantation of hif-1α−/− Tg(kdrl:EGFP) donor cells into WT Tg(kdrl:ras-mCherry) host blastulae and of WT Tg(kdrl:ras-mCherry) donor cells into hif-1α−/− Tg(kdrl:EGFP) host blastulae shown at 48 hpf; white arrowheads point to sprouts from WT DLAV ECs, yellow arrowheads point to sprouts from hif-1α−/− DLAV ECs, white asterisk indicates missing sprout from a WT EC and yellow asterisk indicates missing sprout from a hif-1α−/− EC. (d) Quantification of DLAV sprouts in a 10 somite-long trunk area from WT and hif-1α−/− DLAV ECs in the two different EC transplantation conditions at 48 hpf. (e) Schematic representation of the experiment shown in f–i. (f–h) Transplantation of hif-1α−/− Tg(kdrl:EGFP) donor cells into WT Tg(kdrl:ras-mCherry) host blastulae, and of WT Tg(kdrl:ras-mCherry) donor cells into hif-1α−/− Tg(kdrl:EGFP) host blastulae shown after hypoxia chamber or DMOG treatment for 6 h starting at 48 hpf; white arrow points to vessel rupture affecting WT EC, and yellow arrow points to vessel rupture affecting hif-1α−/− EC. (i) Quantification of blood vessel ruptures in a 10 somite-long trunk area affecting WT and hif-1α−/− ECs in the two different EC transplantation conditions at 54 hpf after hypoxia chamber or DMOG treatment for 6 h starting at 48 hpf. Bars represent mean±s.e.m., n=10 embryos from three different clutches, (**P<0.01; ***P<0.001; ****P<0.0001; NS, no significant changes observed; t-test). Scale bars, 50 μm. |
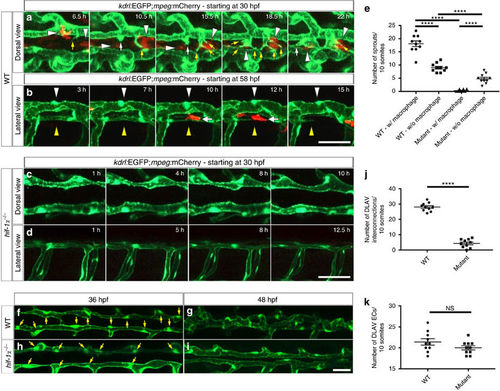
DLAV plexus formation is a macrophage-associated process and it is absent in hif-1α mutants. (a) Maximal intensity projections of time-lapse confocal images of Tg(kdrl:EGFP);Tg(mpeg:mCherry) WT sibling embryo starting at 30 hpf; dorsal views. White arrowheads point to macrophages, yellow arrows to endothelial filopodial extensions, and white arrows to blunt-ended endothelial protrusions. (b) Maximal intensity projections of time-lapse confocal images of Tg(kdrl:EGFP);Tg(mpeg:mCherry) WT sibling embryo starting at 58 hpf; lateral views. White arrowheads point to a segment of a stable and perfused DLAV vessel, yellow arrowheads point to a non-perfused and regressing DLAV vessel, and white arrows point to a macrophage in contact with the regressing vessel. (c,d) Maximal intensity projections of time-lapse confocal images of Tg(kdrl:EGFP);Tg(mpeg:mCherry) hif-1α mutants starting at 30 hpf in dorsal and lateral views. DLAV plexus formation fails to occur in hif-1α mutants. (e) Quantification of sprouts physically associated (w/) or not (w/o) to macrophages in WT and hif-1α−/− embryos between 36 and 48 hpf. (f–i) Maximal intensity projections of confocal z-stacks of Tg(kdrl:EGFP) WT sibling and hif-1α−/− embryos at 36 and 48 hpf; dorsal views. Yellow arrows point to nuclei. (j) Quantification of DLAV interconnections in WT and hif-1α−/− embryos occurring between 36 and 48 hpf. (k) Quantification of EC numbers in the DLAVs in WT and hif-1α−/− embryos at 36 hpf. Bars represent mean±s.e.m., n=10 embryos from three different clutches, (****P<0.0001; NS, no significant changes observed; t-test). Scale bars, 50 μm. |
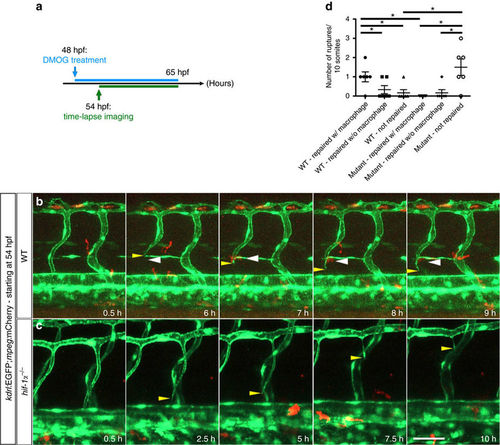
Macrophages do not appear to assist in vessel repair in hif-1α mutants. (a) Schematic representation of the experiment shown in b–d. (b) Maximal intensity projections of time-lapse confocal images of a Tg(kdrl:EGFP);Tg(mpeg:mCherry) WT sibling treated with DMOG starting at 48 hpf. Yellow arrowheads point to a vessel rupture and white arrowheads to macrophages. (c) Maximal intensity projections of time-lapse confocal images of a Tg(kdrl:EGFP);Tg(mpeg:mCherry) hif-1α mutant treated with DMOG starting at 48 hpf. Yellow arrowheads point to a vessel rupture and subsequent regression. (d) Quantification of blood vessel ruptures repaired in the presence (w/) or absence (w/o) of macrophages as well as those not repaired in WT and hif-1α−/− embryos at 65 hpf. All images represent lateral views. Bars represent mean±s.e.m., n=6 embryos from three different clutches, (*P<0.05; t-test). Scale bar, 50 μm. |
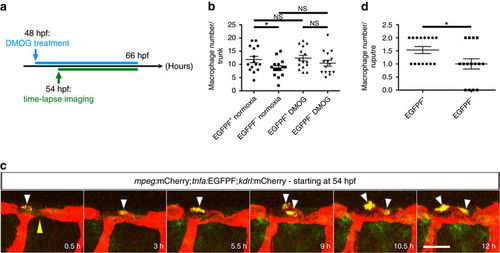
Most macrophages closely associated with unstable vessels are tnfa:EGFPF+. (a) Schematic representation of the experiment shown in b–d. (b) Quantification at 66 hpf of tnfa:EGFPF+ and tnfa:EGFPF− macrophages in normoxia and after DMOG treatment for 18 h starting at 48 hpf. (c) Maximal intensity projections of time-lapse confocal images of Tg(mpeg:mCherry);Tg(tnfa:EGFPF);Tg(kdrl:mCherry) WT embryo treated with DMOG starting at 48 hpf; lateral views. Yellow arrowhead points to an unstable vessel, white arrowheads point to recruited macrophages. (d) Quantification at 66 hpf of tnfa:EGFPF+ and tnfa:EGFPF− macrophages associated with 15 unstable vessels after DMOG treatment starting at 48 hpf. 38 macrophages were observed, 23 tnfa:EGFPF+ and 15 tnfa:EGFPF−. Bars represent mean±s.e.m., n=15 embryos from three different clutches, (*P<0.05; NS, no significant changes observed; t-test). Scale bar, 50 μm. |
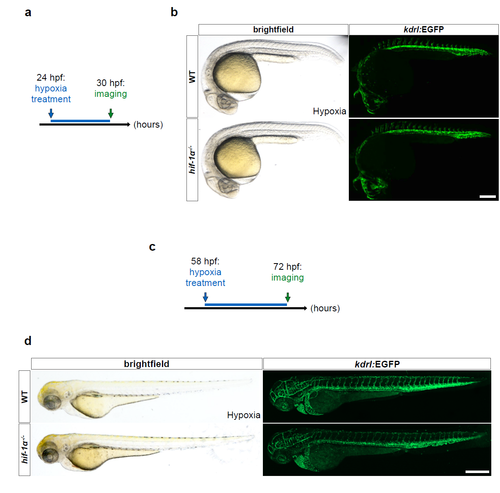
hif-1α mutants do not show vascular anomalies at 30 hpf, and the phenotypes observed at 54 hpf do not appear more severe at 72 hpf. (a) Schematic representation of the experiment shown in b. (b) Representative brightfield images and maximal intensity projections of confocal z-stacks of 30 hpf Tg(kdrl:EGFP) WT sibling and hif-1α-/- embryos after hypoxia chamber treatment for 6 hours starting at 24 hpf; lateral views. n = 3 different clutches. (c) Schematic representation of the experiment shown in d. (d) Representative brightfield images and maximal intensity projections of confocal z-stacks of 72 hpf Tg(kdrl:EGFP) WT sibling and hif-1α-/- larvae after hypoxia chamber treatment for 14 hours starting at 58 hpf; lateral views. n = 3 different clutches. Scale bars, 200 μm. |
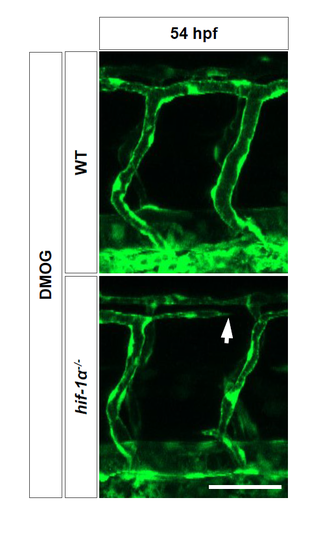
hif-1α mutants exhibit vascular disconnections. Maximal intensity projections of confocal z-stacks of 54 hpf Tg(kdrl:EGFP) WT sibling and hif-1α-/- embryos after DMOG treatment for 6 hours starting at 48 hpf. Arrow points to a blood vessel rupture. n = 3 different clutches. Scale bar, 50 μm. |
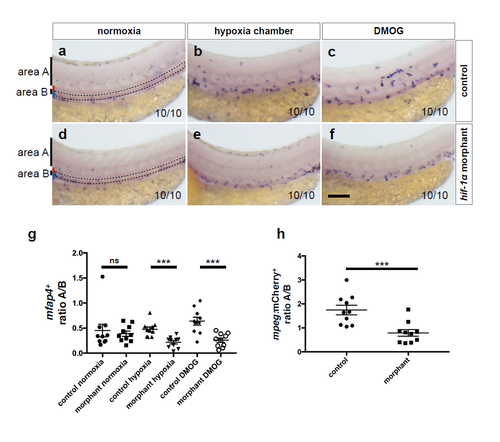
hif-1α morphants phenocopy the macrophage mobilization defects observed in hif-1α mutants. (a-f) Brightfield images of WISH for mfap4 expression in 54 hpf control morphants and hif-1α morphants in normoxia, after hypoxia chamber or DMOG treatment for 6 hours starting at 48 hpf; lateral views. Area A is situated outside the AGM and area B represents the AGM region (outlined). Red bar marks approximate size of the dorsal aorta and blue bar that of the posterior cardinal vein. n = 10 embryos from 3 different clutches. Scale bar, 100 μm. (g) Quantification of macrophage mobilization from the AGM based on mfap4 WISH experiments, showing the ratio of macrophage number in area A to macrophage number in area B. (h) Quantification of macrophage mobilization from the AGM of 54 hpf Tg(kdrl:EGFP);Tg(mpeg:mCherry) control morphants and hif-1α morphants in normoxia. Bars represent mean ± s.e.m., n = 10 embryos from 3 different clutches, (***P < 0.001; ns: no significant changes observed; t-test). |
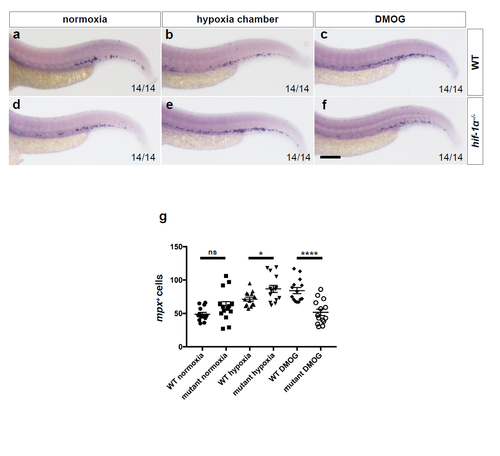
Neutrophil quantification in hif-1α mutants. (a-f) Brightfield images of WISH for mpx expression in 54 hpf WT siblings and hif-1α mutants in normoxia, after hypoxia chamber or DMOG treatment for 6 hours starting at 48 hpf; lateral views (g) Quantification of neutrophil number at 54 hpf. Bars represent mean ± s.e.m., n = 14 embryos from 3 different clutches, (*P < 0.05; ****P < 0.0001; ns: no significant changes observed; t-test). Scale bar, 100 μm. |
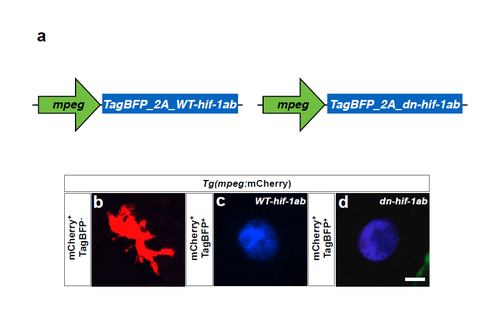
Overexpression of WT-Hif-1ab and dn-Hif-1ab affects macrophage morphology. (a) Plasmids used to mosaically express WT-hif-1ab and dn-hif-1ab. (b) Maximal intensity projections of confocal z-stacks of Tg(mpeg:mCherry) WT macrophage at 54 hpf. (c,d) Maximal intensity projections of confocal z-stacks of a mpeg:TagBFP_2A_WT-hif-1ab +;Tg(mpeg:mCherry)+ hif-1α mutant macrophage and of a mpeg:TagBFP_2A_dn-hif-1ab +;Tg(mpeg:mCherry)+ WT macrophage at 54 hpf. Scale bar, 5 μm. |
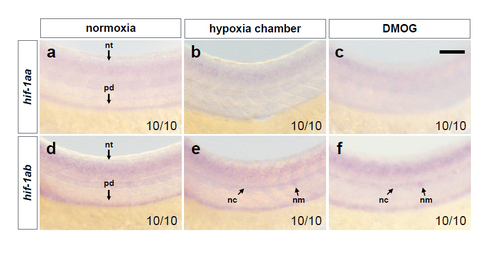
hif-1aa and hif-1ab are not highly expressed in ECs at 54 hpf. (a-c) Brightfield images of WISH for hif-1aa expression in 54 hpf WT embryos in normoxia, after hypoxia chamber or DMOG treatment for 6 hours starting at 48 hpf; lateral views. (d-f) Brightfield images of WISH for hif-1ab in 54 hpf WT embryos in normoxia, after hypoxia chamber or DMOG treatment for 6 hours starting at 48 hpf; lateral views. nt: neural tube; pd: pronephric duct; nc: notochord; nm: neuromast. n = 10 embryos from 3 different clutches. Scale bar, 50 μm. |
DLAV plexus formation is absent in hif-1α morphants. Maximal intensity projections of time-lapse confocal images of a Tg(kdrl:EGFP);Tg(mpeg:mCherry) hif-1α morphant starting at 30 hpf; lateral views. n = 3 different clutches. Scale bar, 50 μm. |
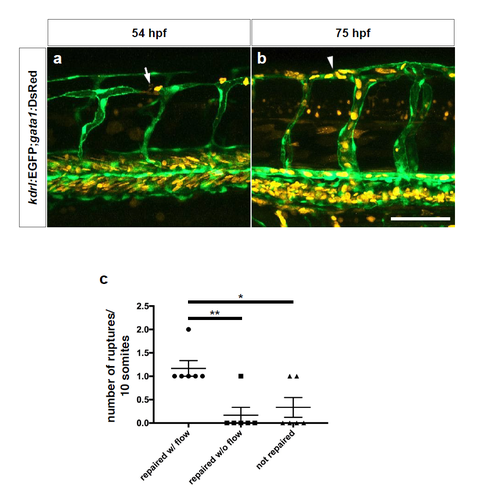
Repaired blood vessels in WT embryos regain blood flow. (a) Maximal intensity projections of confocal z-stacks of a blood vessel rupture in a 54 hpf Tg(kdrl:EGFP);Tg(gata1:DsRed) WT embryo after DMOG treatment for 6 hours starting at 48 hpf. (b) Maximal intensity projections of confocal z-stacks of the same blood vessel in the same embryo after repair. Lateral views; white arrow points to a ruptured vessel showing erythrocyte leakage, white arrowhead points to repaired vessel having regained flow. (c) Quantification of ruptured vessels subsequently repaired and showing presence (w/) or absence (w/o) of flow as well as those not repaired; data collected at 75 hpf. Bars represent mean ± s.e.m., n = 6 from 3 different clutches. (*P < 0.05; **P < 0.01; t-test). Scale bar, 50 μm. |
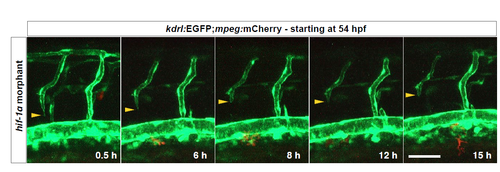
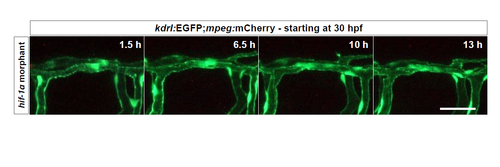
Macrophages do not appear to assist in vessel repair in hif-1α morphants. Maximal intensity projections of time-lapse confocal images of a Tg(kdrl:EGFP);Tg(mpeg:mCherry) hif-1α morphant treated with DMOG starting at 48 hpf; lateral views. Yellow arrowheads point to ruptured vessel. n = 3 different clutches. Scale bar, 50 μm. |