
Fig. S5
- ID
- ZDB-FIG-170907-40
- Publication
- Gerri et al., 2017 - Hif-1α regulates macrophage-endothelial interactions during blood vessel development in zebrafish
- Other Figures
- All Figure Page
- Back to All Figure Page
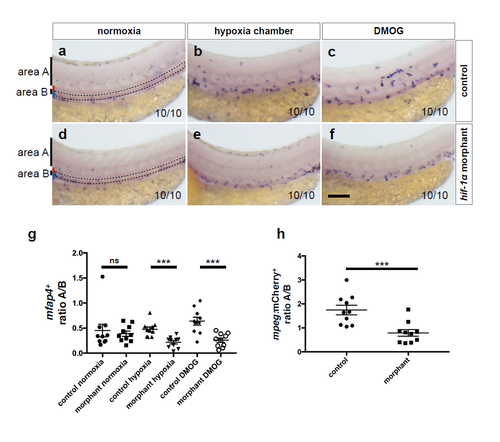
hif-1α morphants phenocopy the macrophage mobilization defects observed in hif-1α mutants. (a-f) Brightfield images of WISH for mfap4 expression in 54 hpf control morphants and hif-1α morphants in normoxia, after hypoxia chamber or DMOG treatment for 6 hours starting at 48 hpf; lateral views. Area A is situated outside the AGM and area B represents the AGM region (outlined). Red bar marks approximate size of the dorsal aorta and blue bar that of the posterior cardinal vein. n = 10 embryos from 3 different clutches. Scale bar, 100 μm. (g) Quantification of macrophage mobilization from the AGM based on mfap4 WISH experiments, showing the ratio of macrophage number in area A to macrophage number in area B. (h) Quantification of macrophage mobilization from the AGM of 54 hpf Tg(kdrl:EGFP);Tg(mpeg:mCherry) control morphants and hif-1α morphants in normoxia. Bars represent mean ± s.e.m., n = 10 embryos from 3 different clutches, (***P < 0.001; ns: no significant changes observed; t-test). |