
|
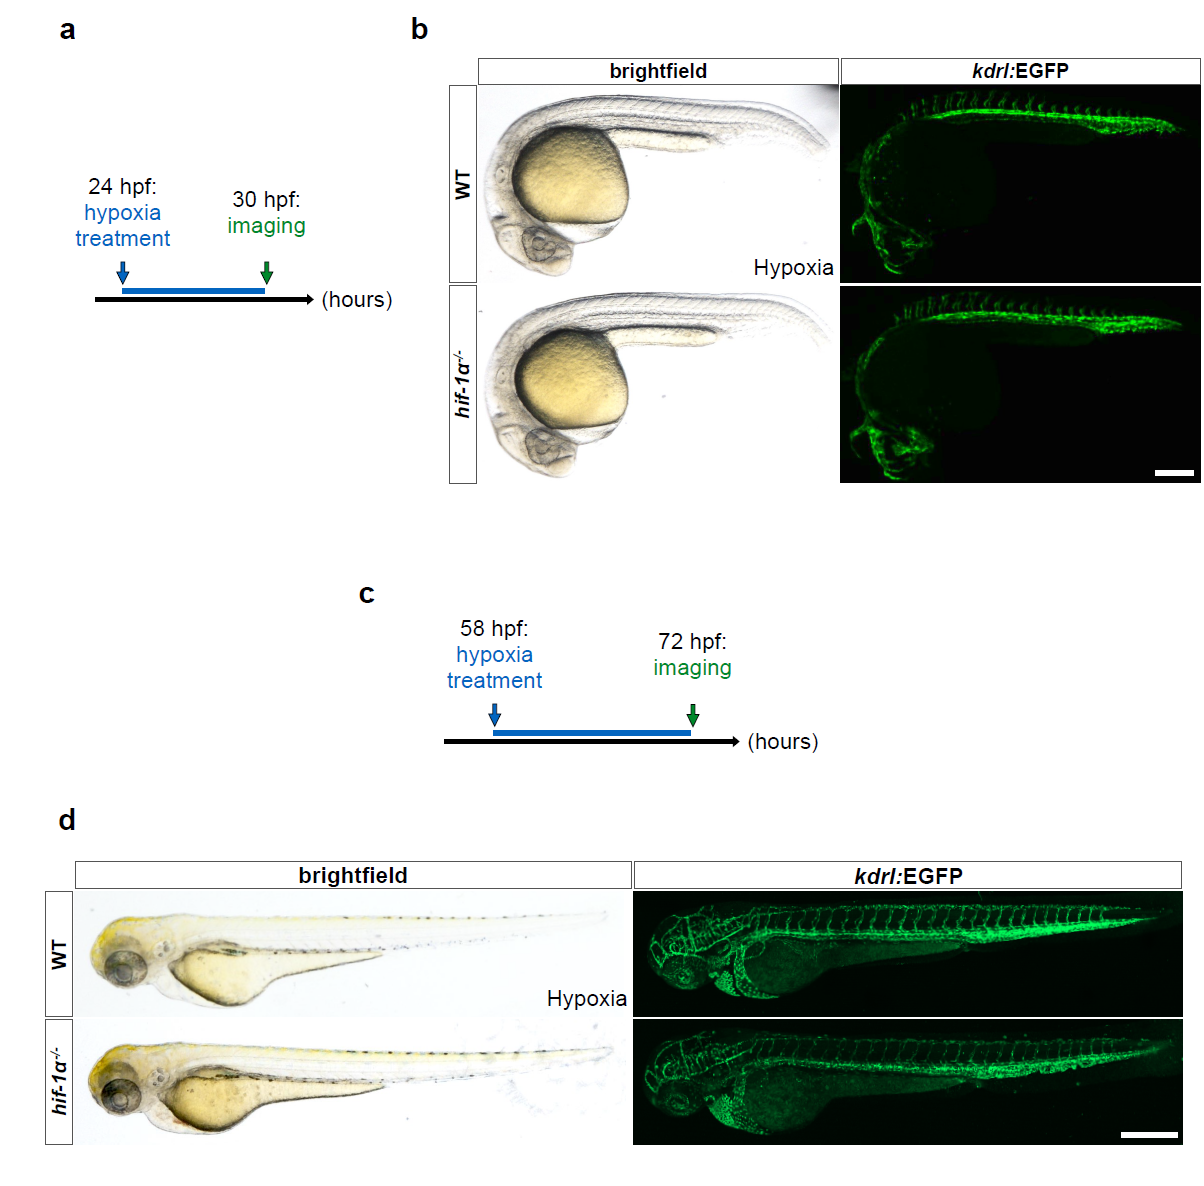
Fig. S3
hif-1α mutants do not show vascular anomalies at 30 hpf, and the phenotypes observed at 54 hpf do not appear more severe at 72 hpf.
(a) Schematic representation of the experiment shown in b. (b) Representative brightfield images and maximal intensity projections of confocal z-stacks of 30 hpf Tg(kdrl:EGFP) WT sibling and hif-1α-/- embryos after hypoxia chamber treatment for 6 hours starting at 24 hpf; lateral views. n = 3 different clutches. (c) Schematic representation of the experiment shown in d. (d) Representative brightfield images and maximal intensity projections of confocal z-stacks of 72 hpf Tg(kdrl:EGFP) WT sibling and hif-1α-/- larvae after hypoxia chamber treatment for 14 hours starting at 58 hpf; lateral views. n = 3 different clutches. Scale bars, 200 μm.