
|
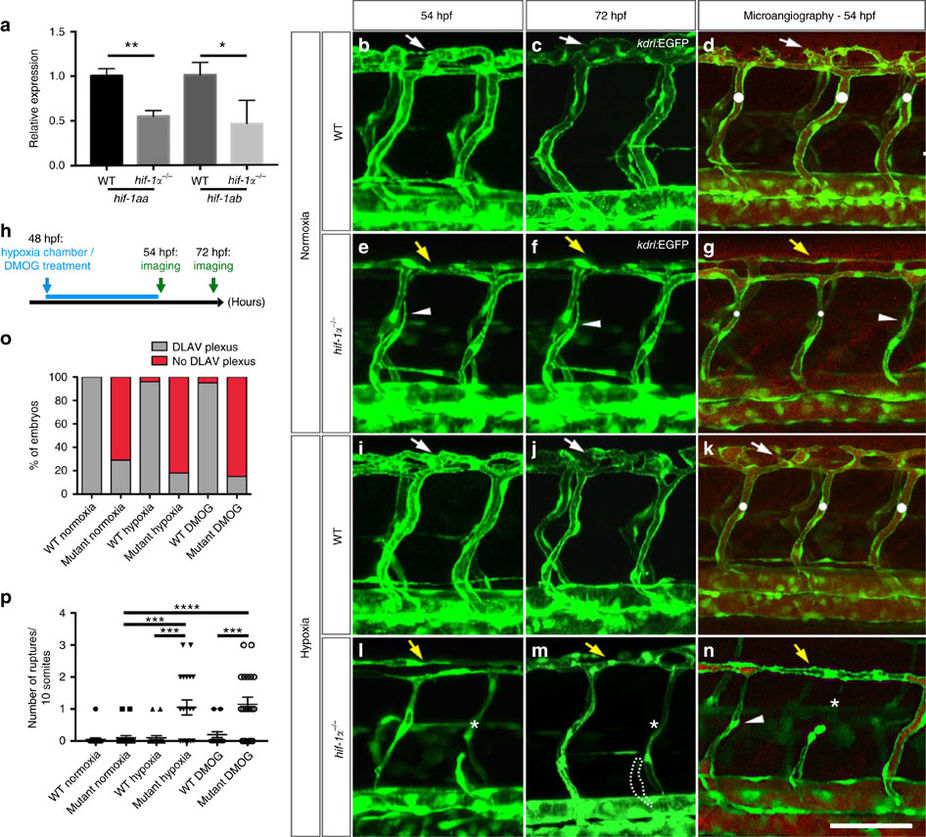
Fig. 2
hif-1α mutants fail to form the DLAV plexus and exhibit hypoxia-induced vascular disconnections.
(a) qPCR analysis of hif-1aa and hif-1ab transcripts in WT siblings and hif-1α mutants at 48 hpf. Values represent mean±s.d., n = 3 biological replicates, (*P<0.05; **P<0.01; t-test). (b–g) Maximal intensity projections of confocal z-stacks of Tg(kdrl:EGFP) WT siblings and hif-1α−/− embryos in normoxia at 54 and 72 hpf, as well as after microangiography at 54 hpf. (h) Schematic representation of the experiment shown in i–p. (i–n) Maximal intensity projections of confocal z-stacks of Tg(kdrl:EGFP) WT siblings and hif-1α−/− embryos after hypoxia chamber treatment for 6 h at 54 and 72 hpf, along with microangiography at 54 hpf. All images represent lateral views. White dots indicate approximate lumen size, white arrows point to DLAV plexus in WT, yellow arrows indicate absence of DLAV plexus in hif-1α−/−, arrowheads point to non-perfused ISVs, asterisks indicate vessel ruptures and dotted lines outline regressed blood vessel. (o) Quantification of embryos showing normal (grey) or abnormal/absent (red) DLAV plexus formation in 54 hpf WT siblings and hif-1α−/− in normoxia, and after hypoxia chamber or DMOG treatment for 6 h starting at 48 hpf. (p) Quantification of blood vessel ruptures in a 10 somite-long trunk area in 54 hpf WT siblings and hif-1α−/−in normoxia, and after hypoxia chamber or DMOG treatment for 6 h starting at 48 hpf. Bars represent mean±s.e.m., n=20 embryos from three different clutches, (***P<0.001; ****P<0.0001; t-test). Scale bar, 50 μm.