
Image
|
Figure Caption
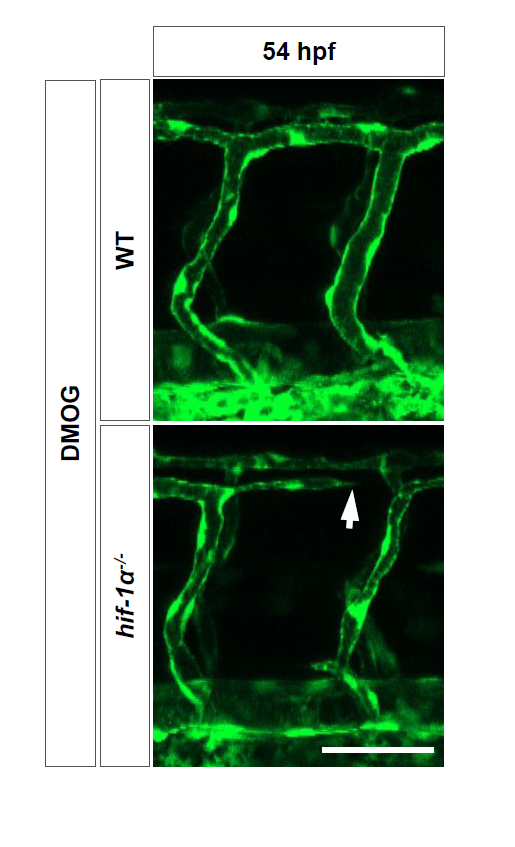
Fig. S4
hif-1α mutants exhibit vascular disconnections.
Maximal intensity projections of confocal z-stacks of 54 hpf Tg(kdrl:EGFP) WT sibling and hif-1α-/- embryos after DMOG treatment for 6 hours starting at 48 hpf. Arrow points to a blood vessel rupture. n = 3 different clutches. Scale bar, 50 μm.
Acknowledgments
This image is the copyrighted work of the attributed author or publisher, and
ZFIN has permission only to display this image to its users.
Additional permissions should be obtained from the applicable author or publisher of the image.
Full text @ Nat. Commun.